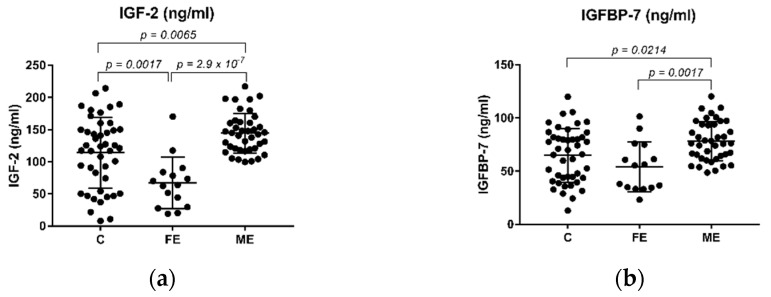
Figure 1.
Plasma levels of IGF-2 (ng/mL) and IGFBP-7 (ng/mL) in SZ patients and healthy controls. (a) Levels of IGF-2 are significantly downregulated in the FE group when compared to the healthy control and the ME groups; (b) Levels of IGFBP-7 are significantly downregulated in the FE group compared to the ME group. Tukey’s multiple comparison test was used, and significant p-values are shown in each graph. FE: First Episode drug-naïve patients, ME: multiple or chronic patients.

