
Figure 2.
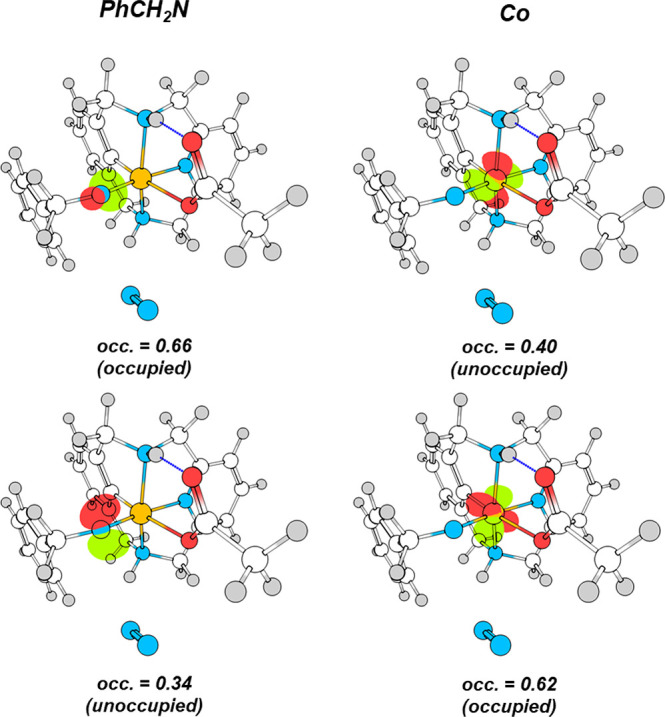
Effective fragment orbitals (EFOs) graphical representation and occupations—in the [0,1] range—associated with the σ (top) and π (bottom) interaction between the PhCH2N ligand and the Co center.
Official websites use .gov
A
.gov website belongs to an official
government organization in the United States.
Secure .gov websites use HTTPS
A lock (
) or https:// means you've safely
connected to the .gov website. Share sensitive
information only on official, secure websites.
Effective fragment orbitals (EFOs) graphical representation and occupations—in the [0,1] range—associated with the σ (top) and π (bottom) interaction between the PhCH2N ligand and the Co center.