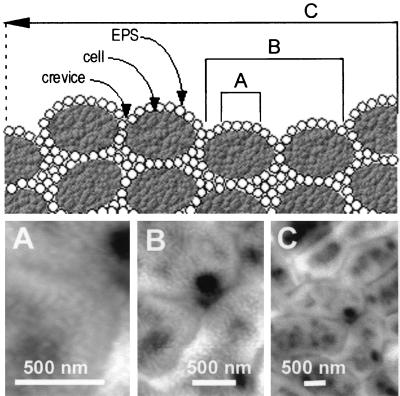
FIG. 4.
Three scales of roughness on biofilms. (Top) Conceptual diagram. (Bottom) AFM height images of unsaturated P. putida mt-2 biofilms. Each of the three length scales provides different values for roughness, which probably vary due to the predominating surface feature at that scale: (A) within cells (0.5-μm scale), mesoscale structures of EPS determine roughness; (B) across 1 or 2 cells (2-μm scale), roughness is from EPS and boundaries between bacteria; (C) roughness averaged over many cells (5-μm and greater scale) is likely dominated by fluctuations in biofilm thickness and boundaries between bacteria.

