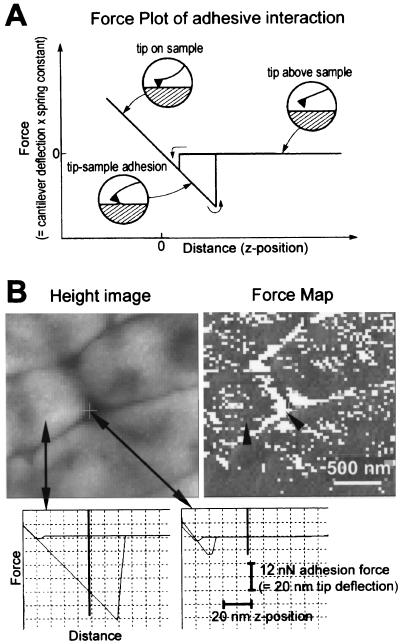
FIG. 6.
Biofilm force map. (A) Diagram of the tip-sample interactions occurring as the AFM tip approaches and retracts from an adhesive surface. The force plot consists of two curves: one for the tip approaching the sample and one for the tip retracting from the sample. During the approach, the cantilever moves from right to left in the diagram, and the cantilever deflects as it presses into the biofilm. In the retract curve, the cantilever deflects sharply before separating from the biofilm as it moves from left to right in the diagram. The horizontal region of the curve represents the tip not in contact with the biofilm, and the sloped region of the curve represents the tip in contact with the biofilm. The slope for a hard surface is approximately 1 nm of deflection/nm of z distance, while softer surfaces show a more gradual deflection (33). (B) Force map analysis of unsaturated P. putida mt-2 biofilm. Biofilm was 2 days old, unwashed, and desiccated at 75.5% RH. Height image arrows show where example force plots were acquired. Lighter regions are higher than darker regions. Force map (force-volume image) shows patterns of adhesion on surface of biofilm. Darker regions are more adhesive than lighter regions. Arrowheads indicate pixels on force map where force plots were acquired. Scale bar indicates the x-y scales of the force map and height image. Force-versus-distance curves on cell surface (left) and between cells (right) show the large adhesion on the bacterial surface and small adhesion between bacteria. Vertical bars on force plots show the z position represented in the force map (= 50 nm above the position of maximum cantilever deflection into surface). Scale bars give x and y dimensions of force plots.

