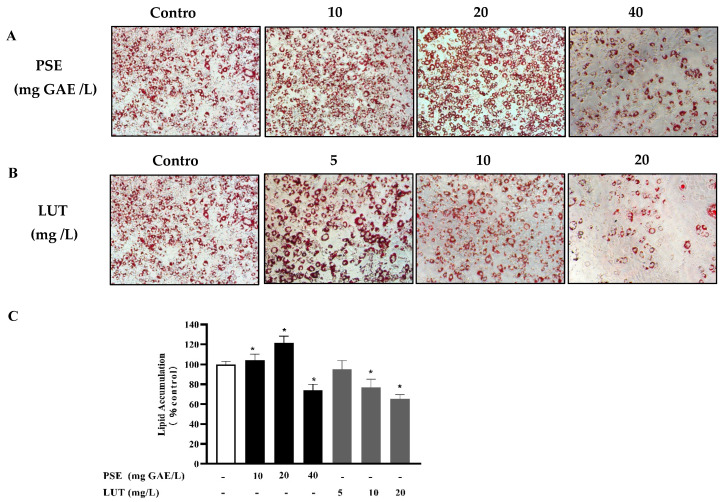
Figure 2.
The effect of PSE and LUT on the lipid accumulation in 3T3-L1 adipocytes after 10 d. (A) Oil Red O staining of the 3T3-L1 cells treated with different PSE concentrations (0 mg GAE/L, 10 mg GAE/L, 20 mg GAE/L and 40 mg GAE/L) at 200× magnification. (B) Oil Red O staining of the 3T3-L1 cells treated with different LUT concentrations (0 mg/L, 5 mg/L, 10 mg/L and 20 mg/L) at 200× magnification. Scale bar = 200 μm. (C) Quantification by measuring the absorbance at 510 nm. Data are presented as the mean ± S.D. from three independent experiments. * Significant differences are indicated by p < 0.05.

