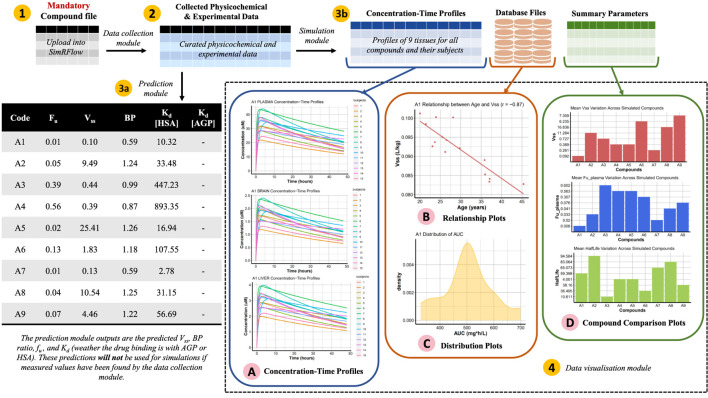
FIGURE 3.
Schematic representation of SimRFlow’s functions being applied on the exemplar compound file in Table 4 (label 1). The data collection module generates a table of the curated physicochemical and experimental data (label 2) which it uses to activate the prediction module (label 3a) or the simulation module (label 3b). The data visualisation module returns a range of plotting options for understanding the simulation outputs (label 4).

