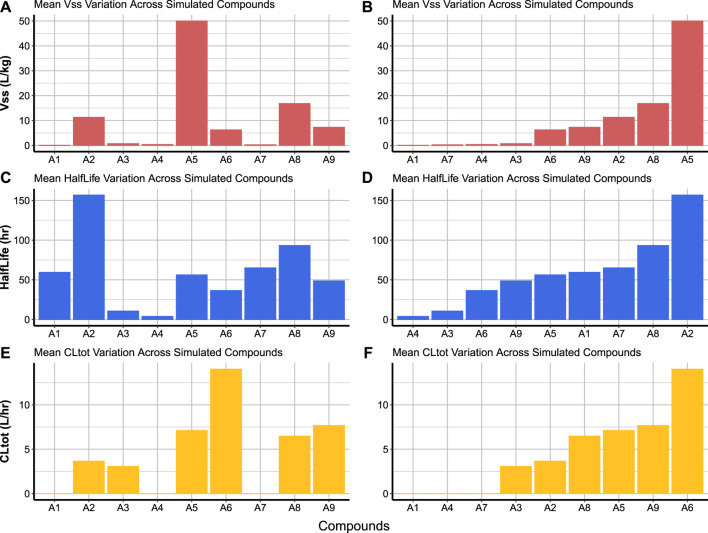
FIGURE 7.
Cross-compound comparison charts allow the visualisation of different parameter means for each compound across the simulated populations. The bars can be organised in the alphanumeric order of compound codes as in panels (A), (C), and (E), or in ascending order of parameter values as in panels (B), (D), and (F).

