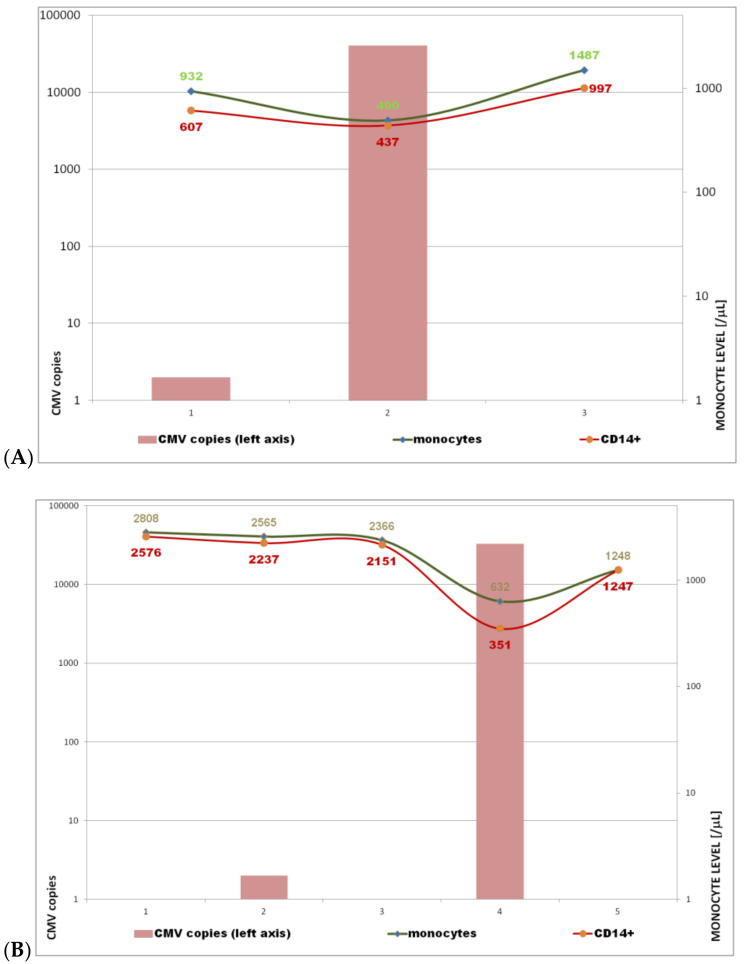
Figure 4.
Relationship between CMV-DNA and monocyte count. Monocyte level and CMV copy numbers on 105 nucleated cells of the whole blood (as the box) were expressed on the right and left axis, respectively.] According to the guidelines and diagnostic chain (see section Material and Methods), the CMV monitoring was carried out once a week. The course of CMV disease is presented in the timeline (weekly results are shown on the x-axis) until viremia withdrawal or fatal outcome. Exponential function of viremia with various bases (b) that are a positive real number higher than 1 and whole copy CMV number as a values of function f(x) = bx, when b > 1; x > 0. Representative patient plots of each group are shown in 3 clinical situations and outcomes: (A) symptomatic infection with rapid latency, exponent x = 4.77. (B) oligosymptomatic infection with rapid relapse with intensive symptoms of CMV mononucleosis and good outcome x = 4.52. (C) symptomatic primary infection with temporary viremia disappearance, prolonged intensive mononucleosis and relapse with fatal outcome. The exponential growth of viremia was the highest x = 5.77.


