
Fig. 10:
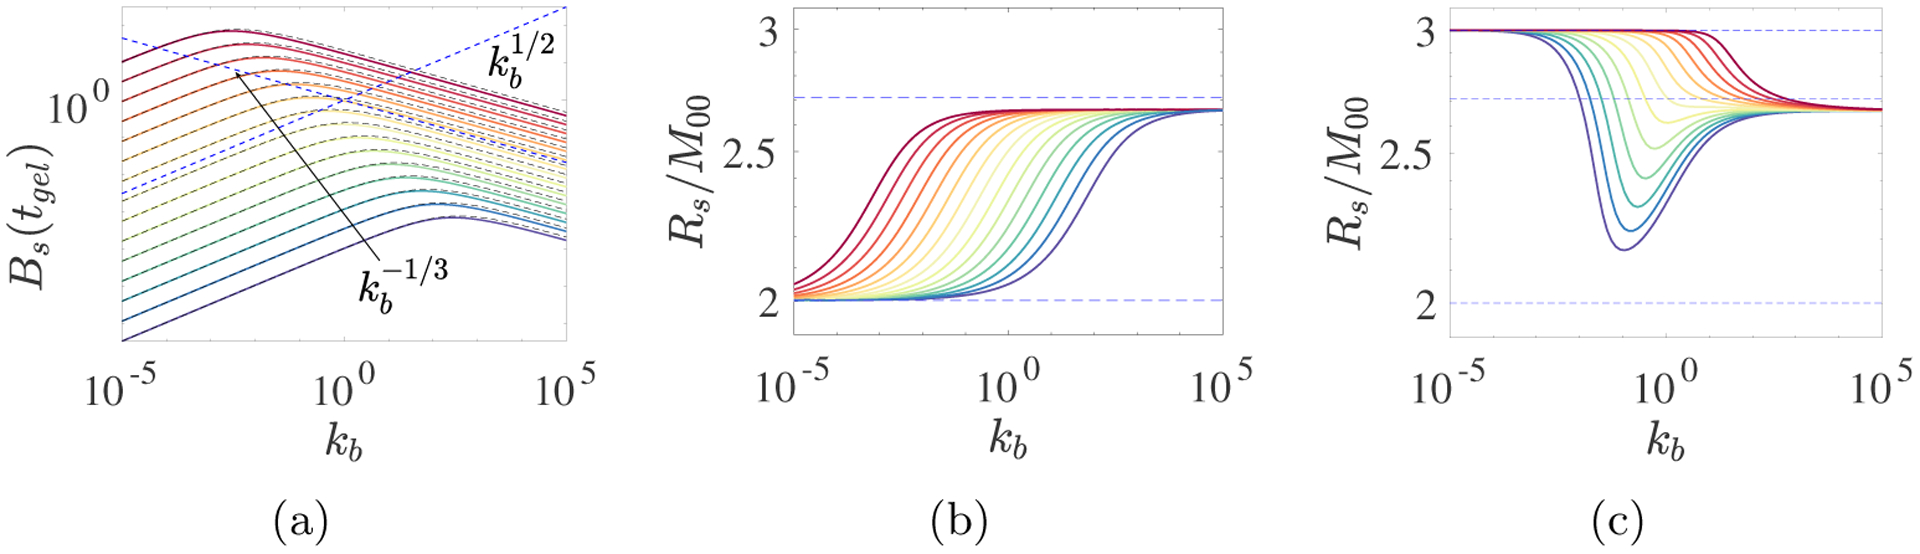
ODE model calculations for various branching rates kb and various (a,b) constant source rates S10 and (c) time-varying source rates. (a) Colored curves show Bs(tgel), blue dashed lines show its scaling behaviors, and black curves show approximate Bs(tgel) from Eq. 3.10 using rss values computed by solving Eq. 3.5 numerically; (b) Colored curves show average functionality fA = Rs/M00 at tgel. In (a) and (b), S10 decreases from 105 (deep red curve) to 10−5 (deep blue curve). Dashed blue line in (b) and (c) is 2/(1 − Bs/Rs) ≈ 2.7093 (see text). (c) Average functionality for time-varying source rate S10(t) = m0λ exp(−λt) m0 = 4 and λ decreases from 105 (deep red curve) to 10−5 (deep blue curve). Branching rates kb vary as indicated.