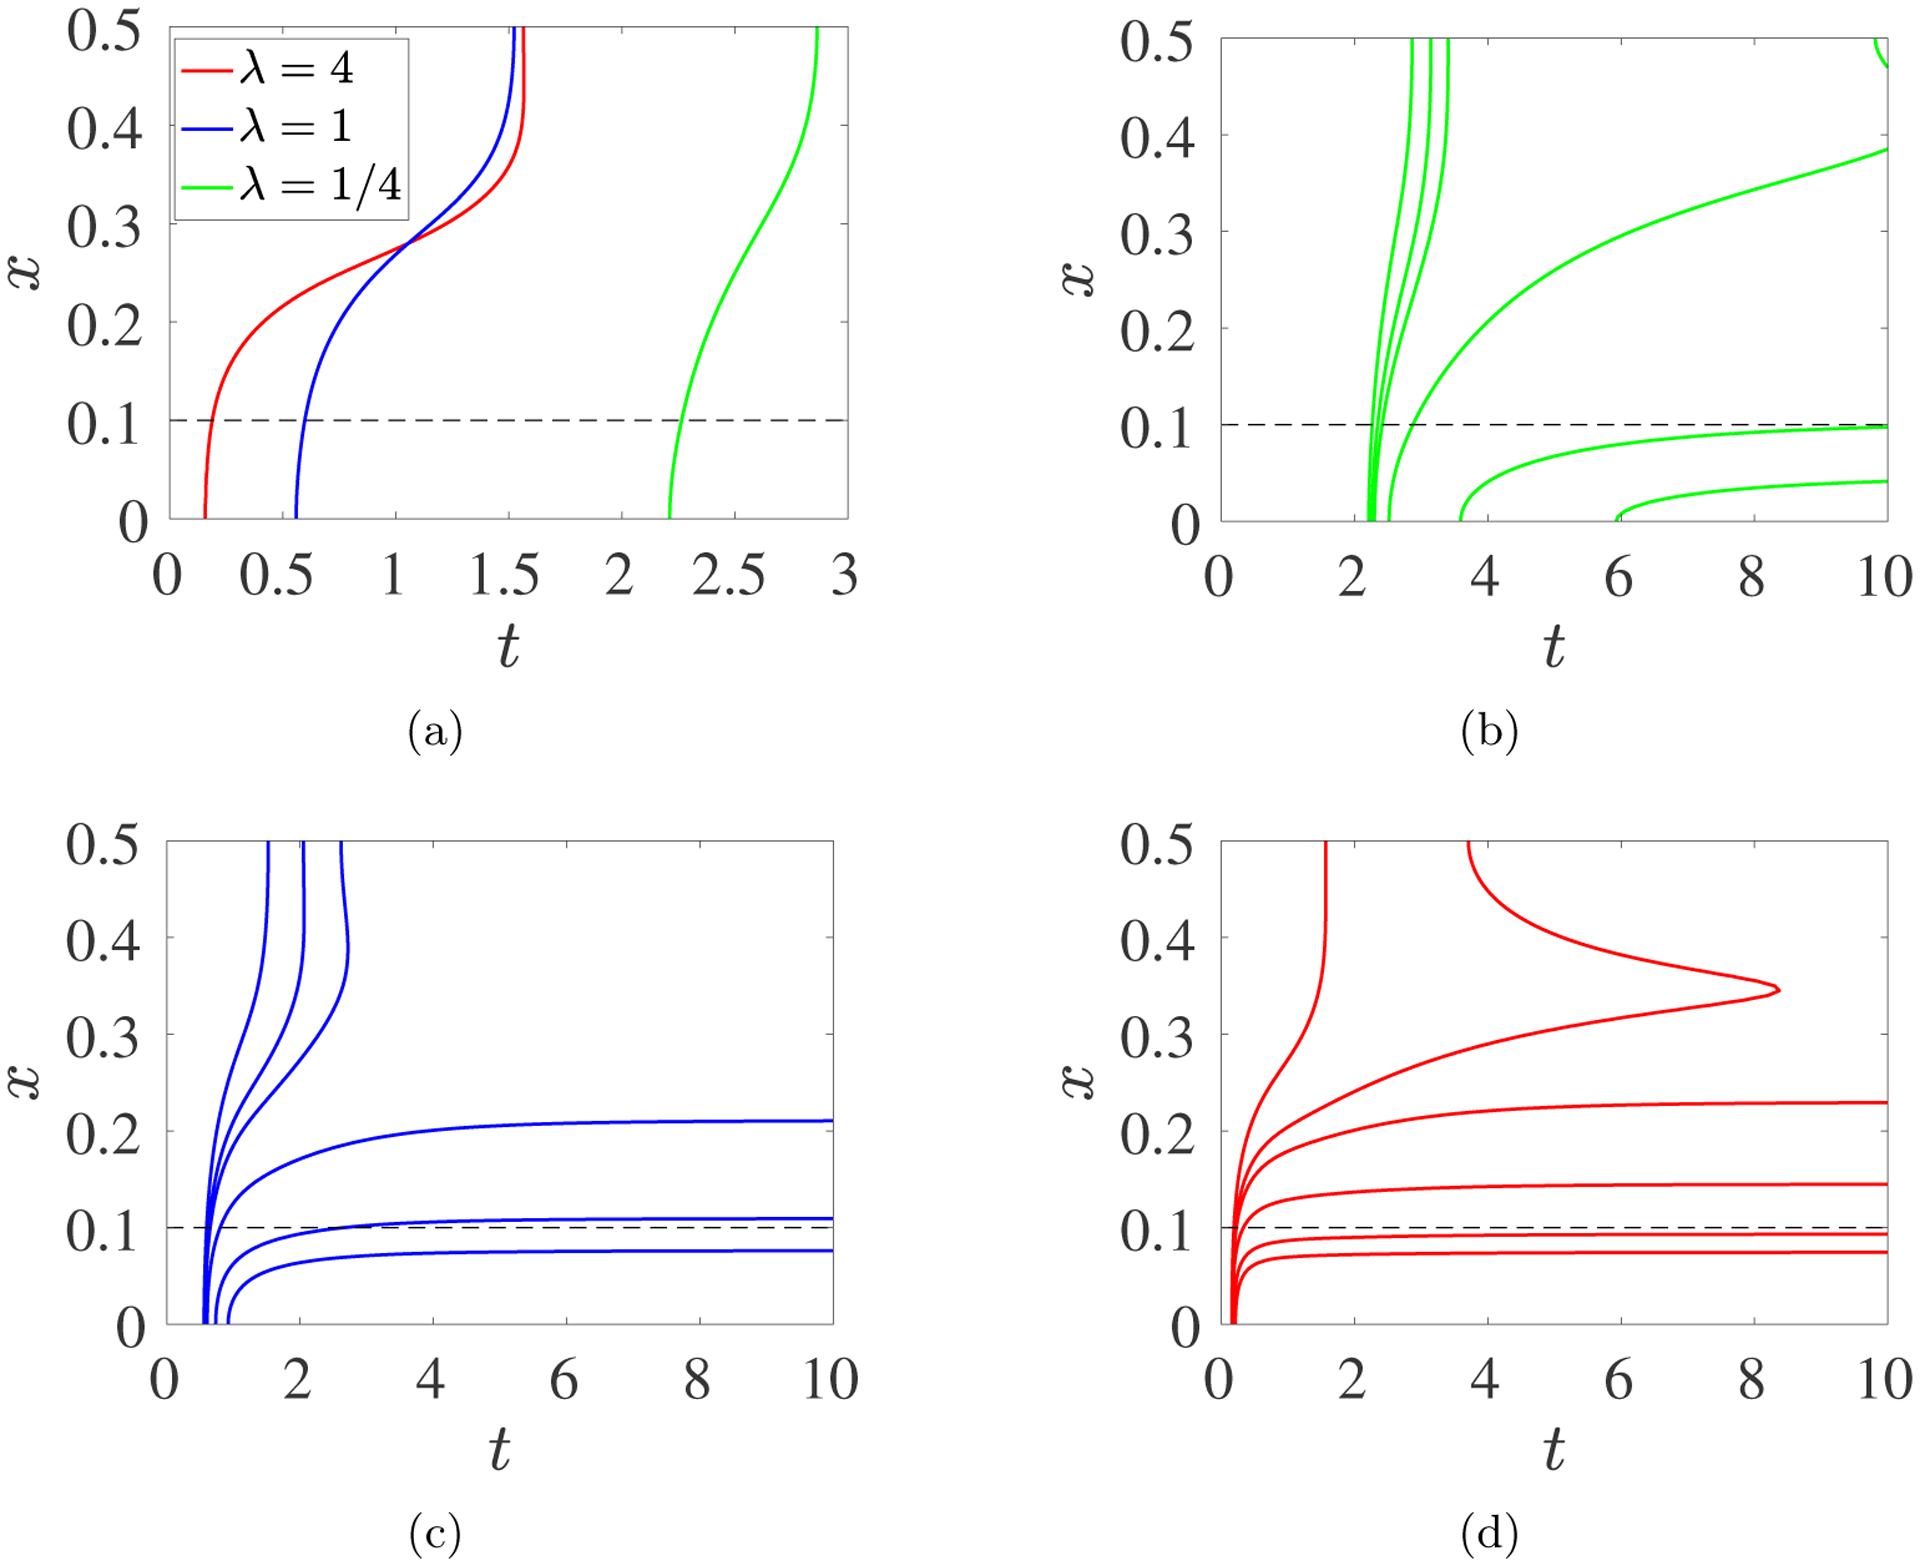
Fig. 11:

PDE model simulations with source rate S10(x, t) given in Eq. 3.12, with m0 = 8, kb = 4, λ = 0.25, 1.0, 4.0, contours of Rg in the xt–plane. (a) Contour Rg(x, t) = Bg(x, t) = 0.001 for λ = 4.0 (red), 1.0 (blue), and 0.25 (green). Each contour defines the gel front location xgel(t) vs t. (b,c,d) Contours Rg(x, t) = Bg(x, t) = 0.001, 0.005, 0.01, 0.05, 0.25, and 0.50 (increasing from left to right) for (b) λ = 0.25, (c) λ = 1.0, and (d) λ = 4.0. The black dashed lines show the upper edge of the monomer source’s support. Note the different time interval in (a).
