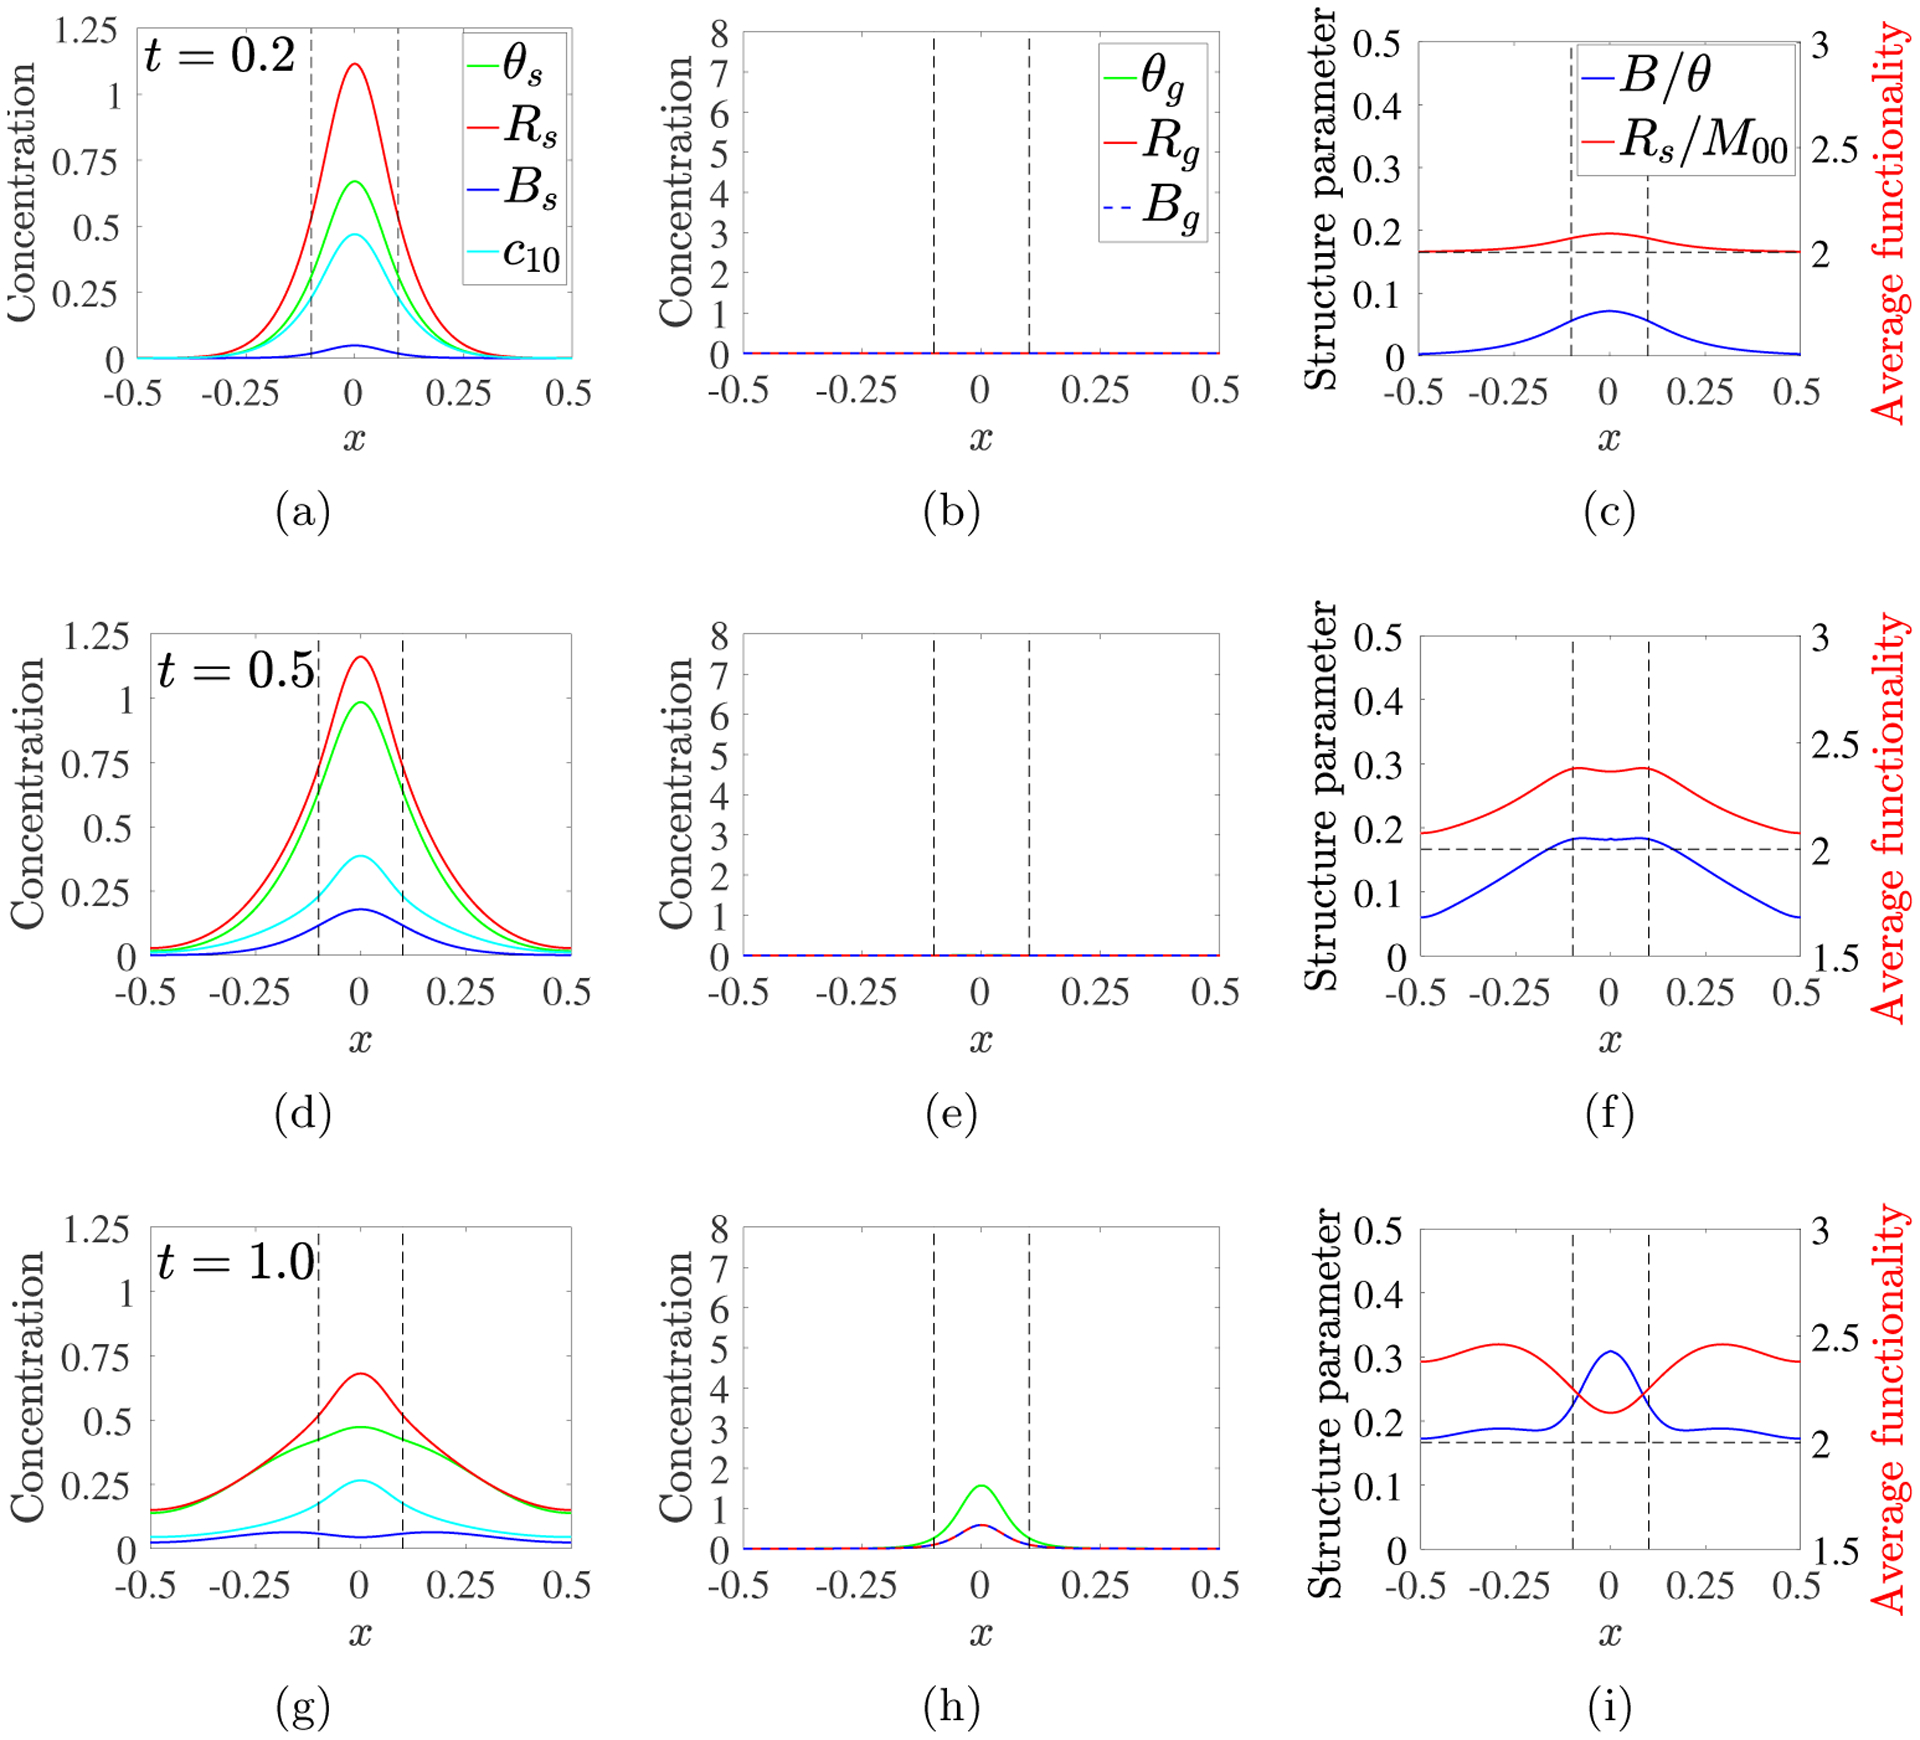
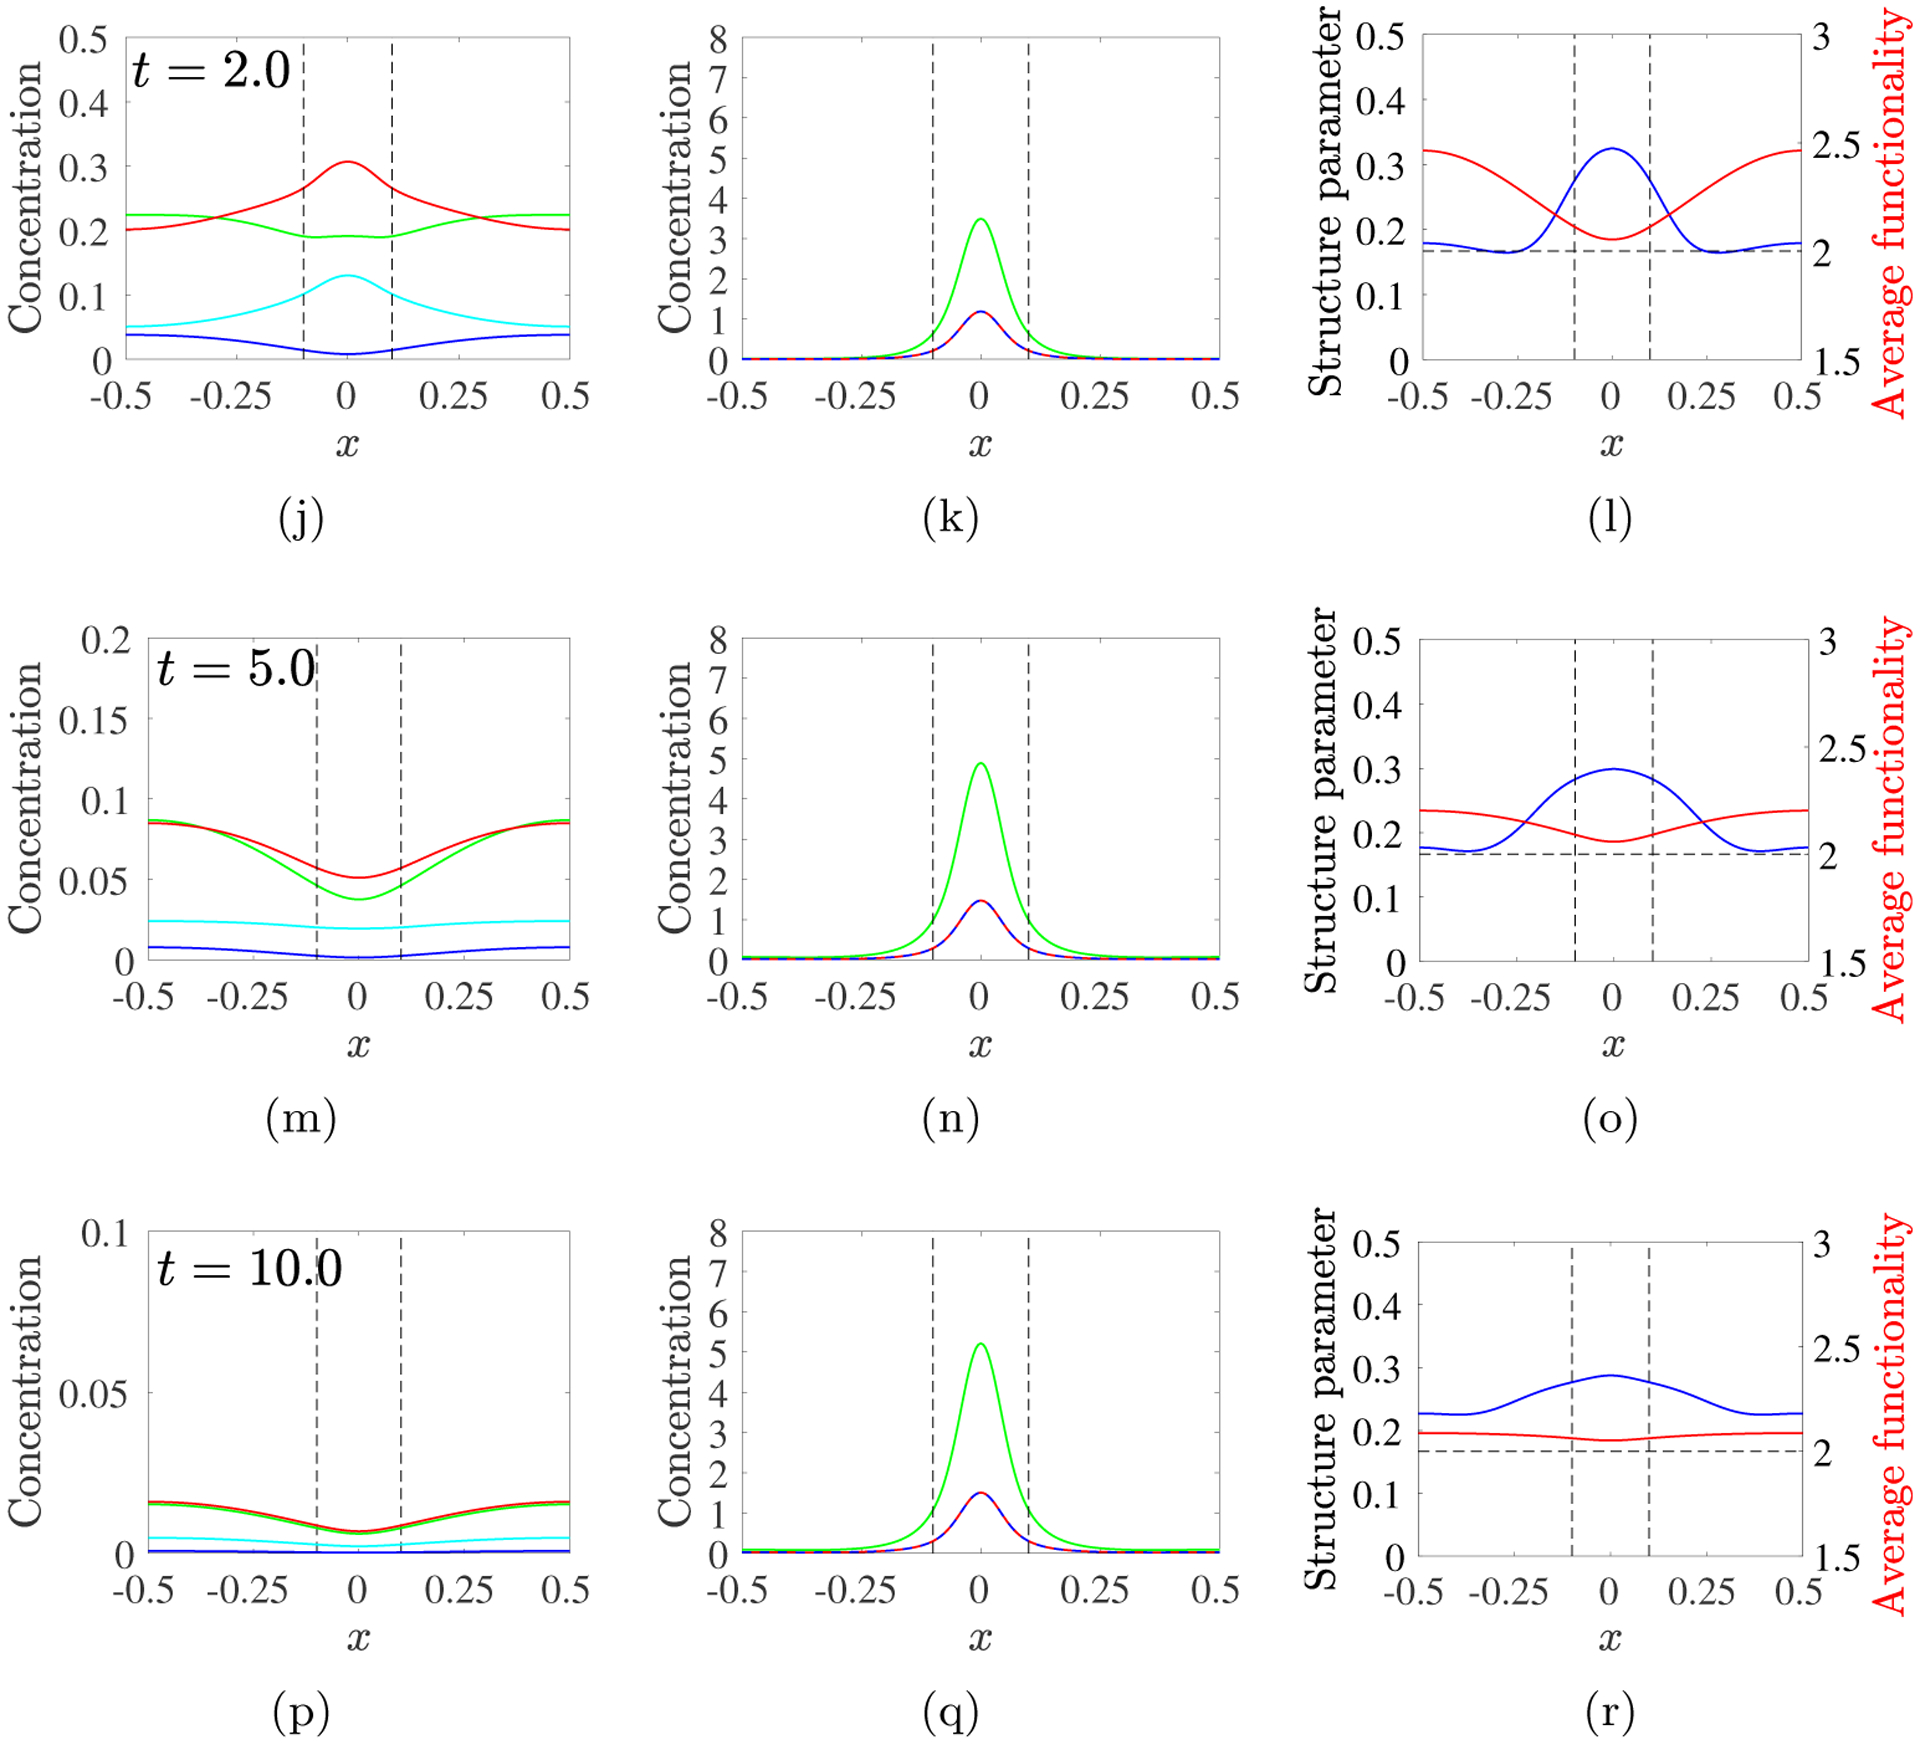
Fig. 12:


PDE model simulations with source rate S10(x, t) given in Eq. 3.12, with m0 = 8, kb = 4, λ = 1, D = 0.04. Snapshots of sol variables (left) gel variables (middle), and structure variables (right) at the times indicated for each row. Note change in vertical scale in left column. Black dashed vertical lines show extent of source’s spatial support.
