Fig. 3:

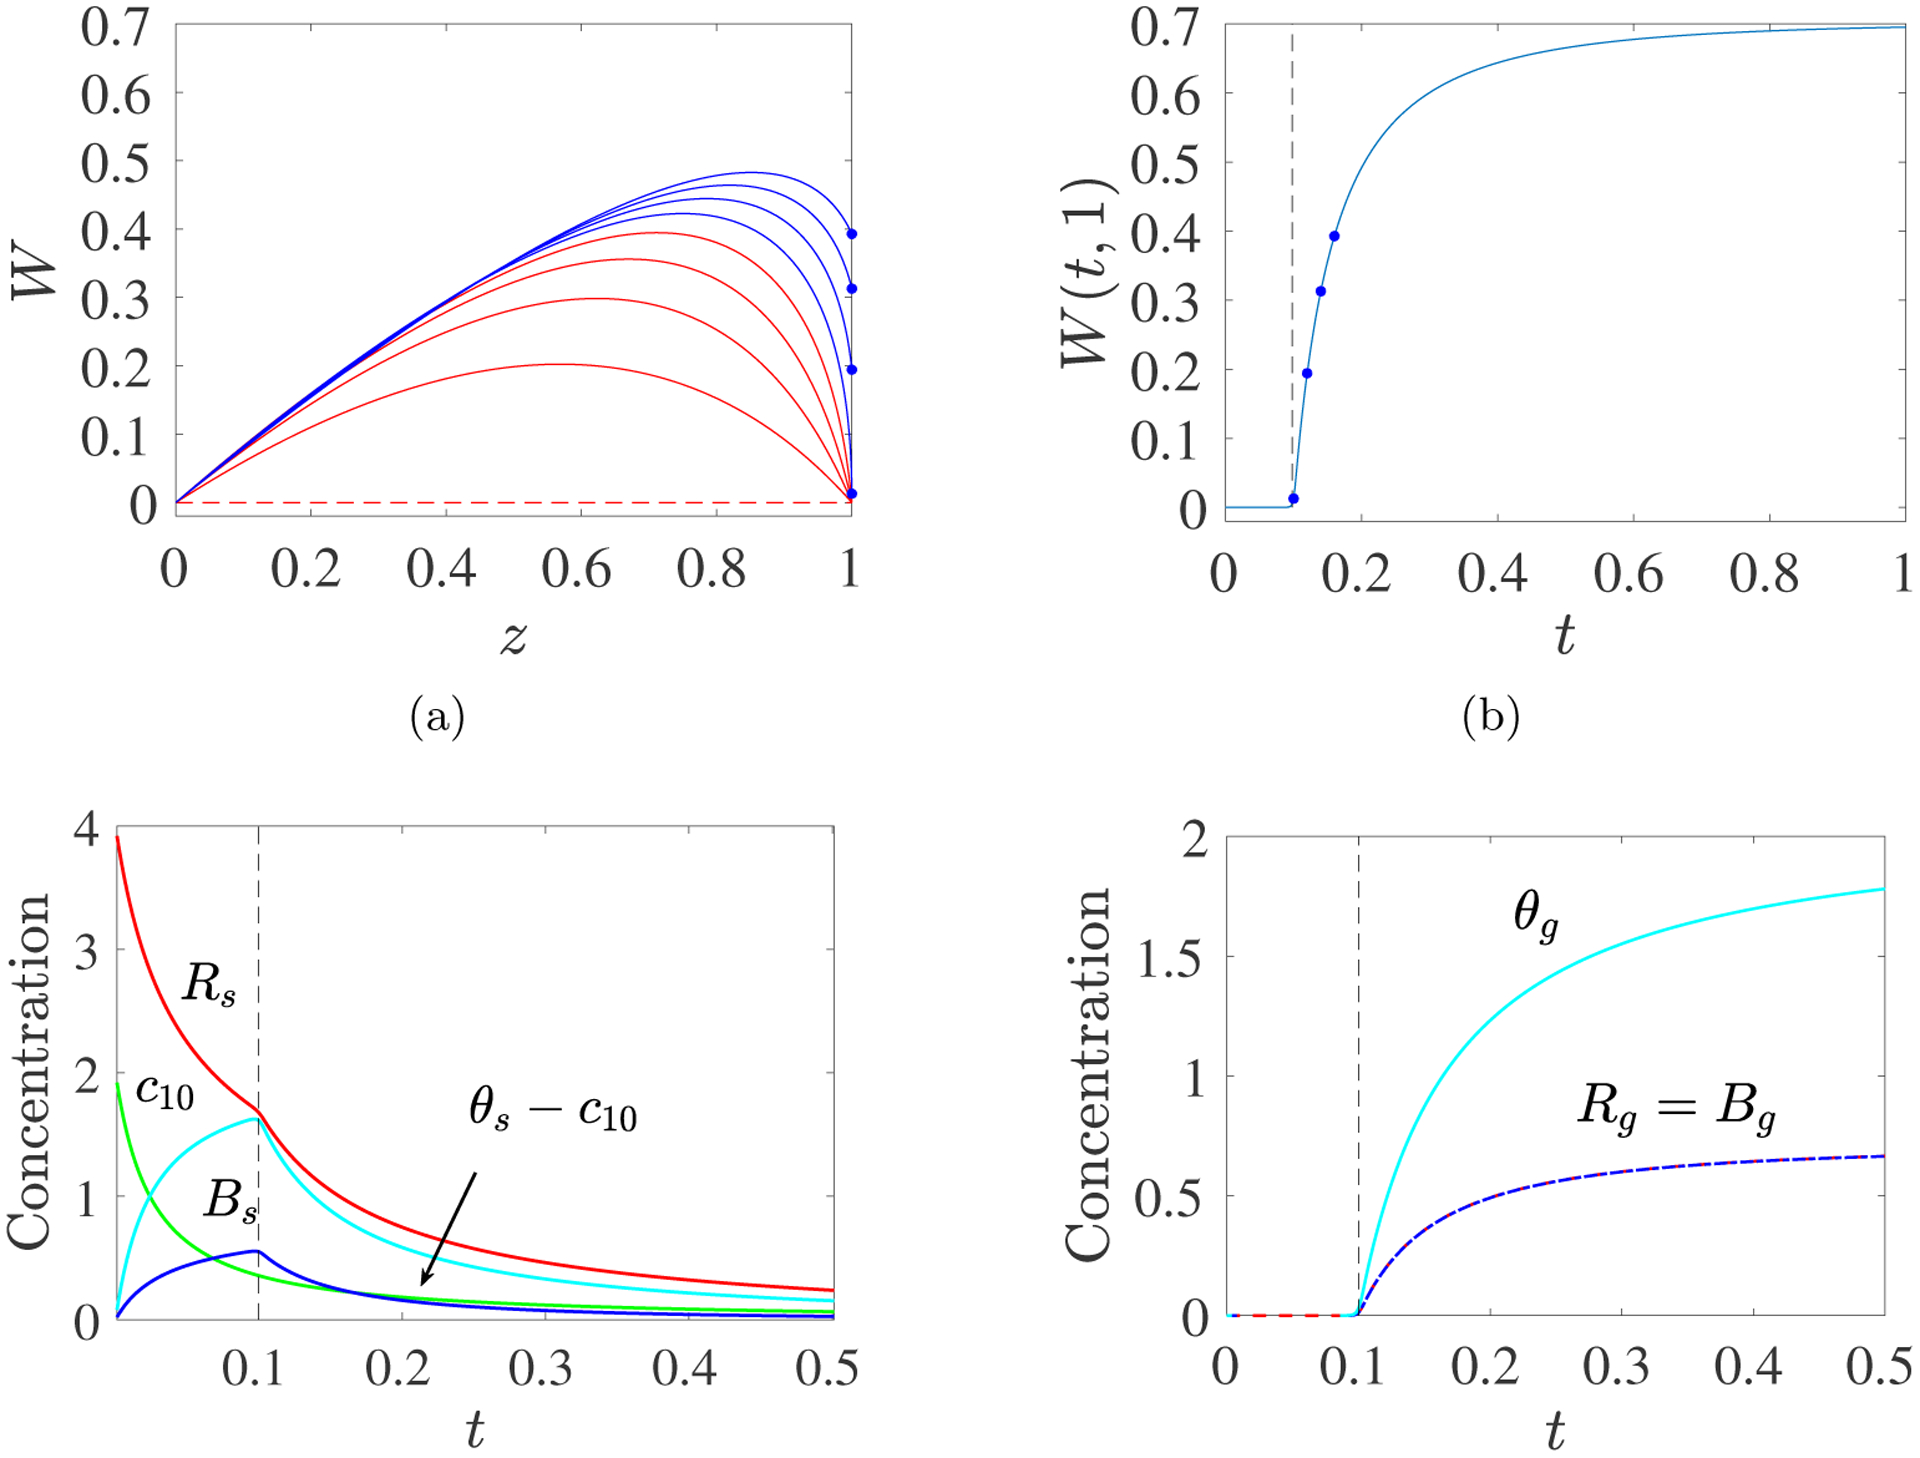
PDE Model with Spatially-uniform Initial Monomer Concentration: c10(0) = 2, kl = 1, kb = 2. (a) Time snapshots of profiles W(t, z) vs z. The curves move upward with time and are colored red before gel time and blue afterward. Values of W(t, 1) for t > tgel are shown with dots. (b) Plot of W(t, 1) vs t. Dots show (t, W(t, 1)) values corresponding to the dots in panel (a). (c) Time dependence of the concentrations of monomer c10, sol reactive sites Rs, sol branches Bs, and mass in finite size oligomers larger than monomers θs − c10. (d) Time dependence of the concentrations of gel reactive sites Rg, gel branches Bg, and gel mass θg. Note different concentration scales in panels (c) and (d). Dashed black line indicates gel time.
