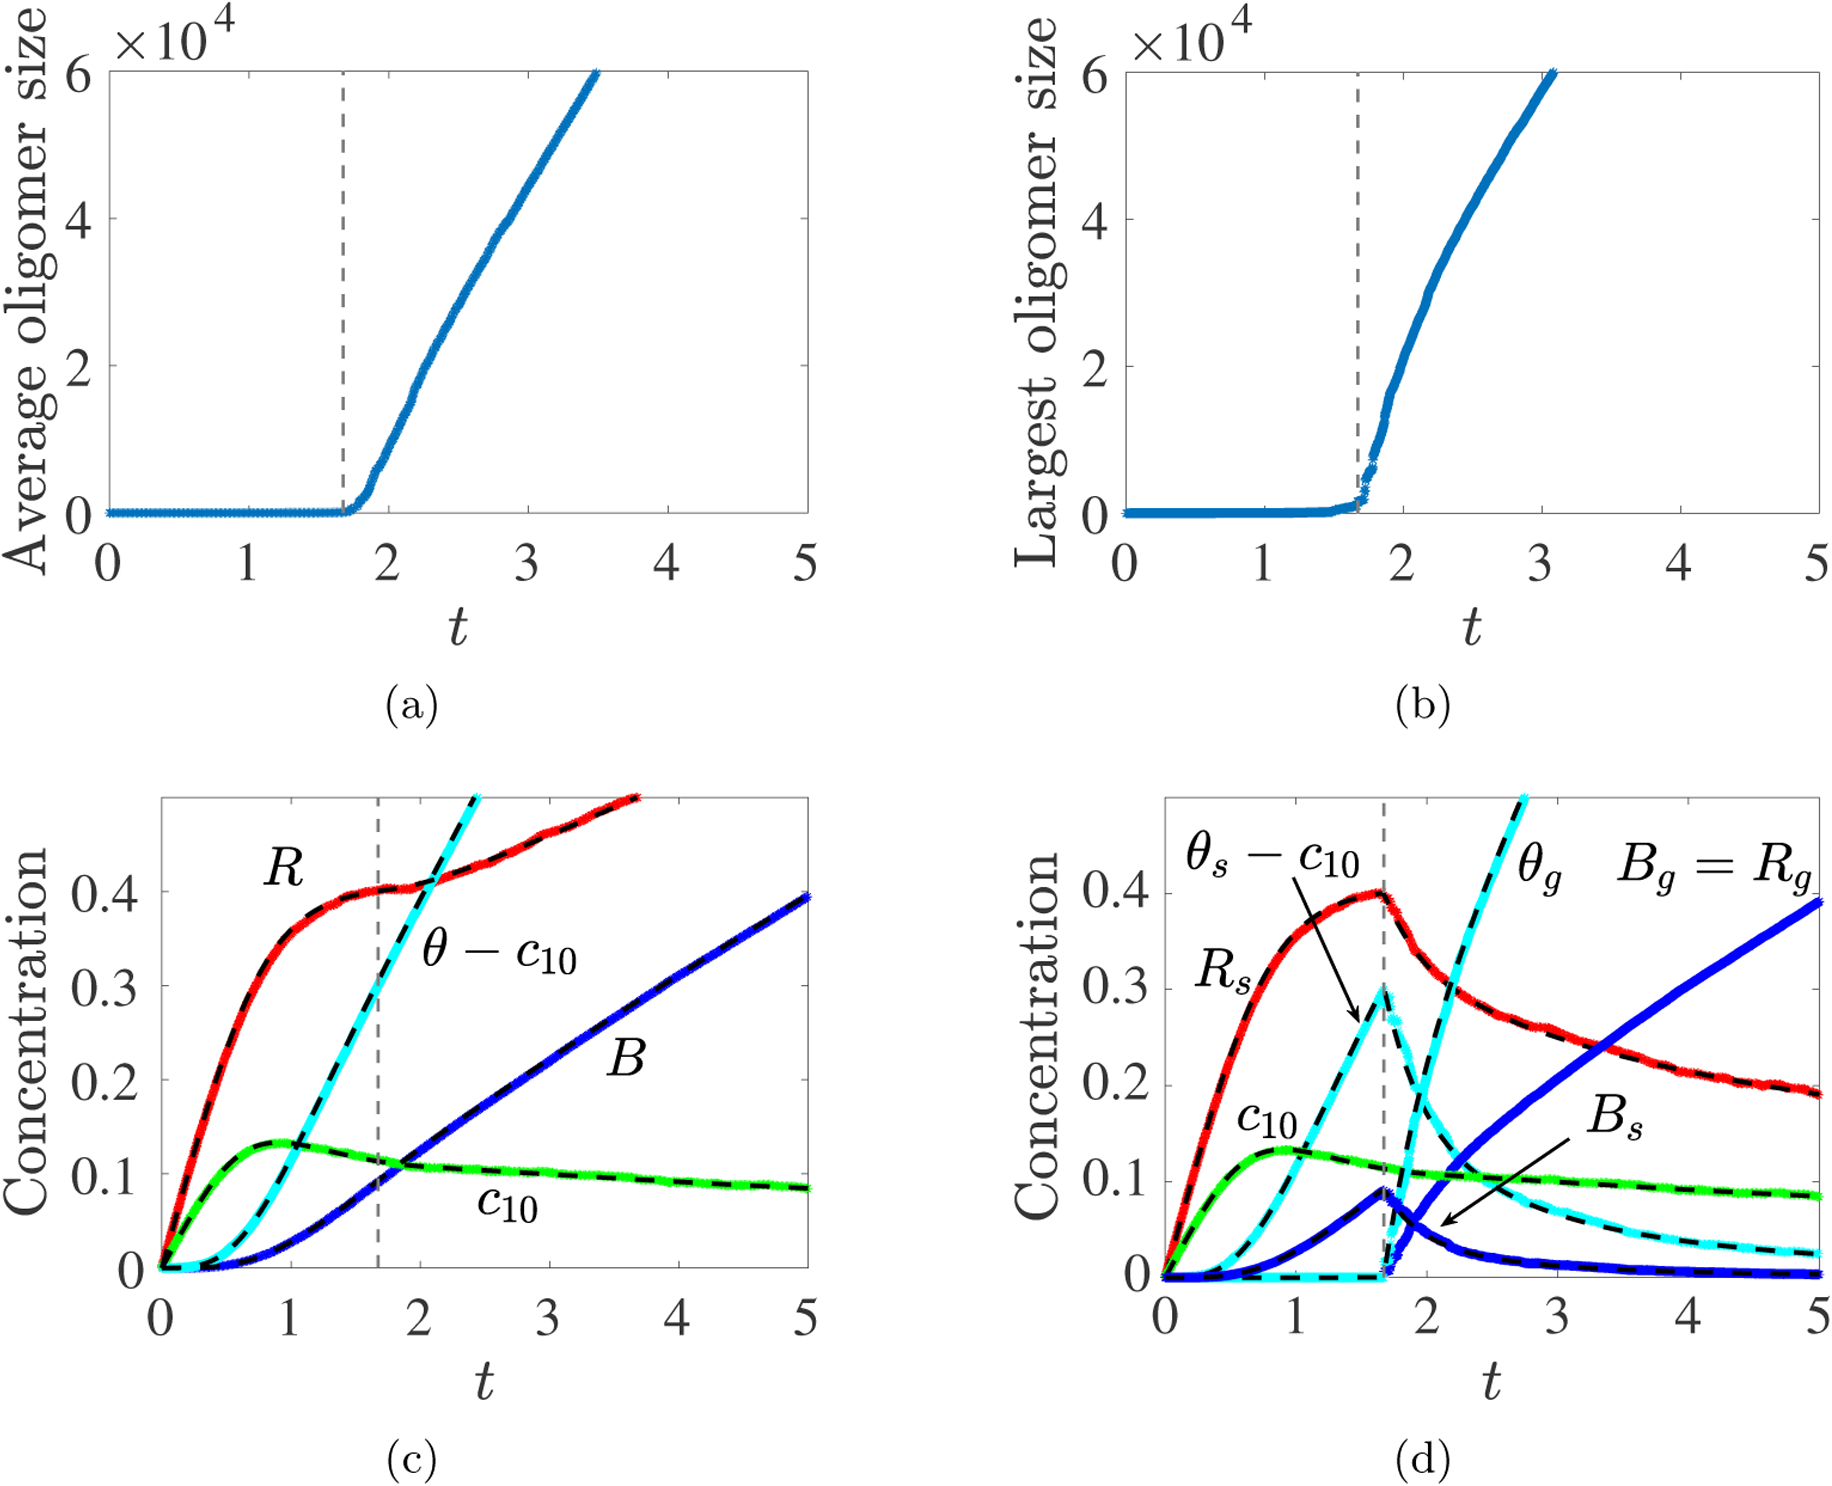
Fig. 5:

Gillespie Simulations. Rate constants kl = 1, kb = 10, source rate S10 = 0.25, and volume v = 105. (a) Average oligomer size vs. t, (b) Largest oligomer size vs. t, (c) R(t), B(t), θ(t) and c10(t) from Gillespie Simulation (colors) and ODE model (dashed black) show excellent agreement up to tgel. (d) After tgel, the mass density (θg), branch point density (Bg) and reaction site density (Rg) of the largest oligomer (colors) agree well with the corresponding gel variables (dashed black) from the PDE model.
