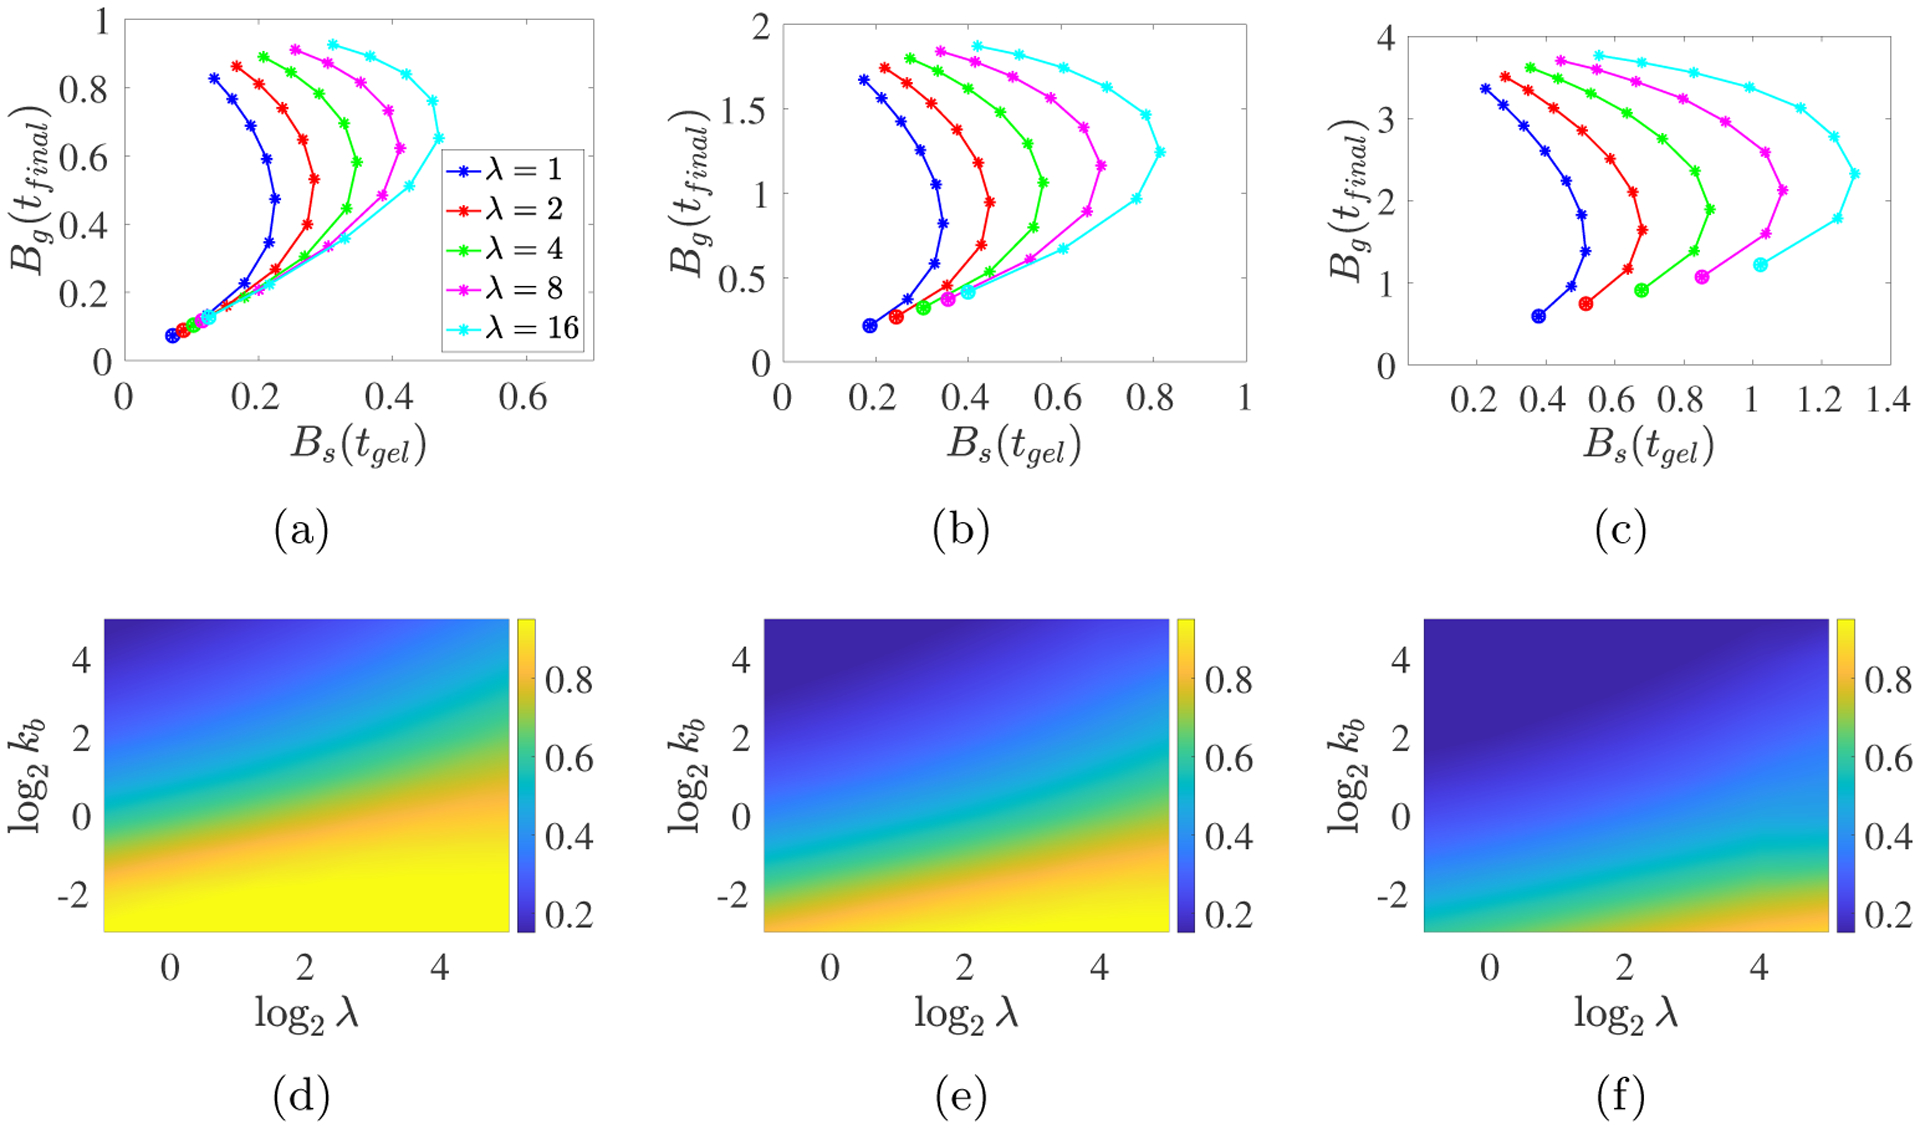
Fig. 7:

PDE model simulations with a spatially-uniform time-varying monomer source S10 = m0λ exp(−λt) for (a,d) m0 = 2, (b,e) m0 = 4, and (c,f) m0 = 8. (a-c) Each curve corresponds to a specific λ value as indicated in the legend, and the points along each curve are for the different kb values with the large dots indicating kb = 1/8 and the kb values increasing from that point to kb = 32 at the other end of the curve. Note the different vertical scales. (d-f) The heatmaps show Bs(tgel)/Bg(tfinal).
