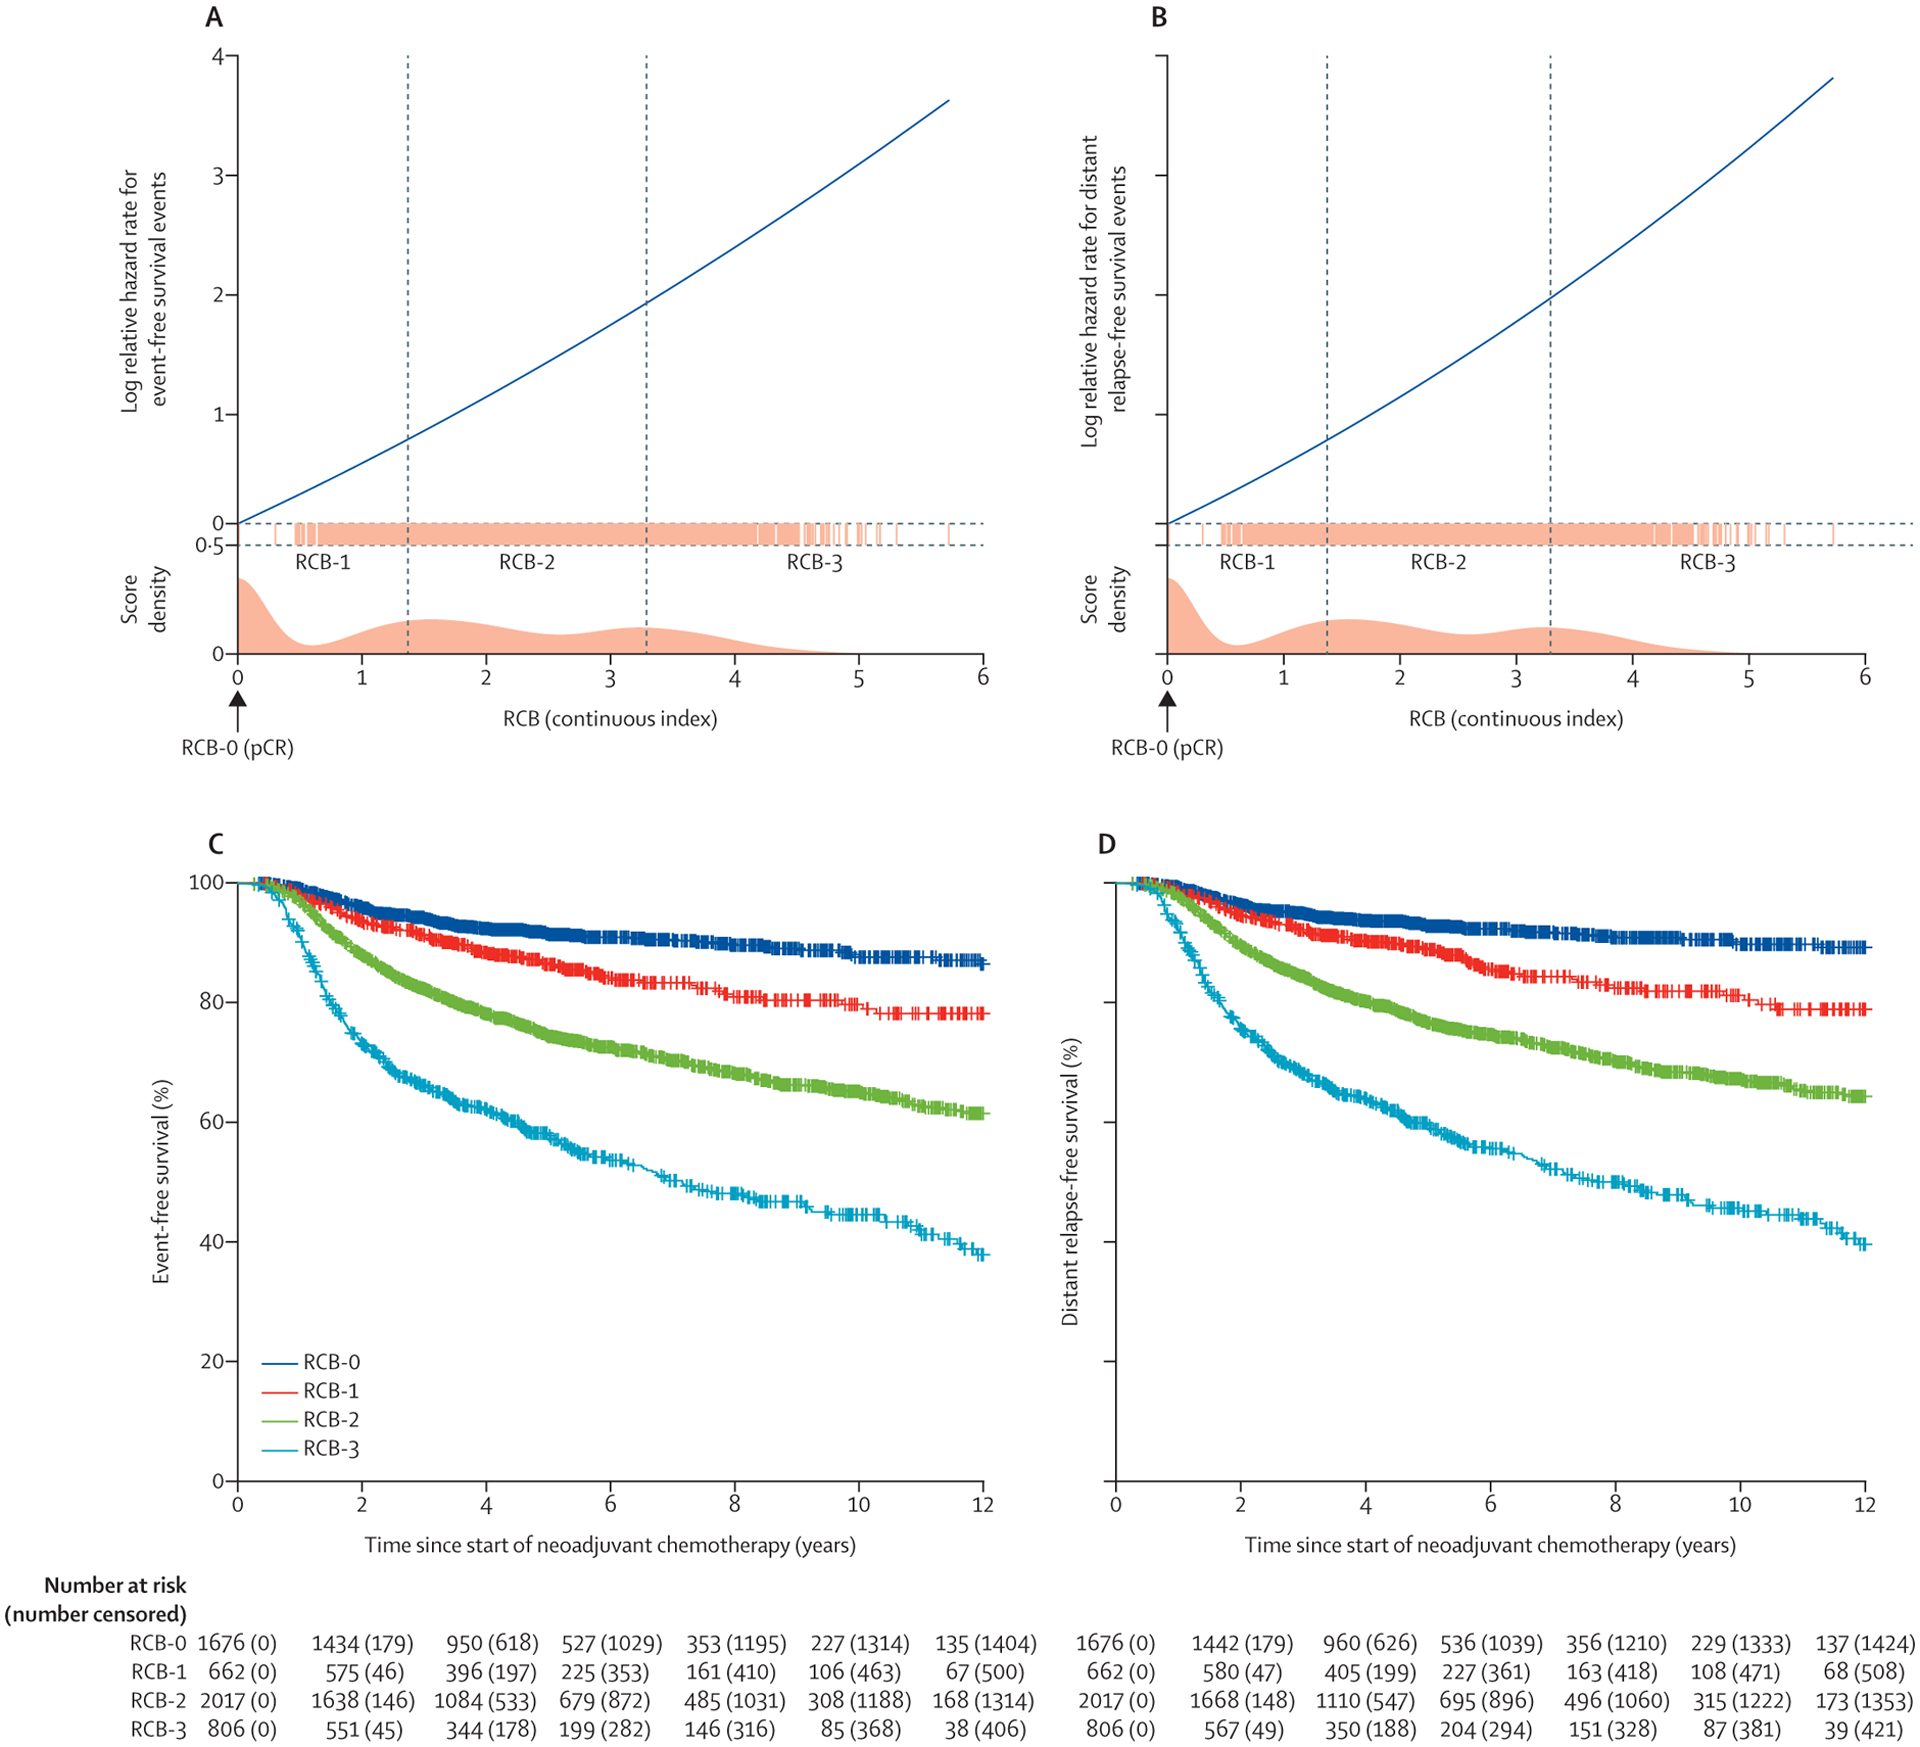
Figure 2: Prognostic value of RCB score and RCB class in the overall pooled analysis cohort.

Plots of log relative hazard rate for event-free survival events (A) and distant relapse-free survival events (B) as a function of RCB score. Splines approximation of RCB with two degrees of freedom was used to allow for non-linear effect. A log linear increase in relative hazard rate implies that the hazard ratio associated with change in RCB remains constant over the range of RCB. Thresholds for corresponding RCB classes (RCB-0 to RCB-3) are shown for reference (vertical dashed lines). Vertical bars represent all RCB scores recorded on a continuous scale. Kaplan-Meier plots of event-free survival (C) and distant relapse-free survival (D) stratified by RCB class. Crosses denote patients censored. RCB=residual cancer burden. pCR=pathological complete response.
