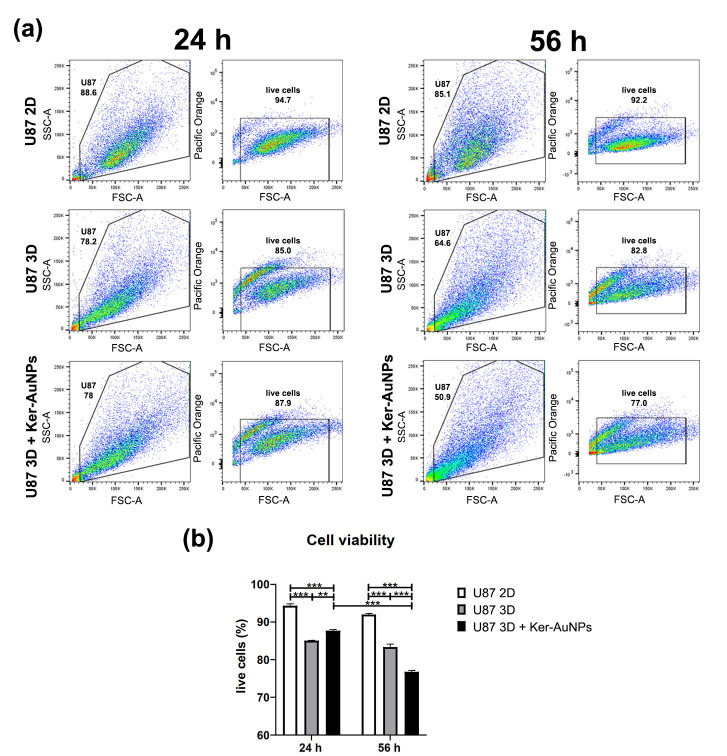
Figure 4.
Cell viability. FACS analysis (a) of U87-MG cultured in the 2D standard condition and in 3DB constructs, with or without Ker-AuNPs, after 24 (left panel) and 56 (right panel) h. The quadrant plots show cells identified by physical parameters using side scatter (SSC-A) and forward scatter (FSC-A). Pacific orange marker was used to detect live cells. Percentage of live cells (b) in the different culture conditions after 24 and 56 h. ** p < 0.002, *** p < 0.001 were considered statistically significant. n = 3 for each experimental group.

