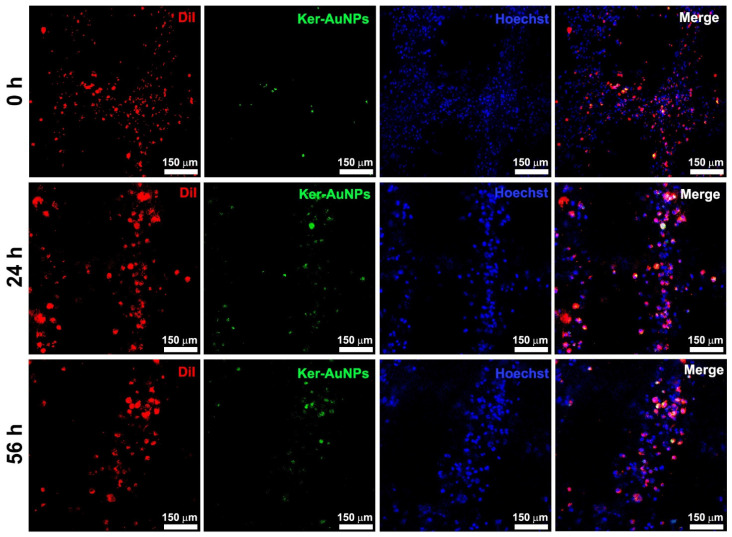
Figure 5.
Immunofluorescence assay. Representative images of 3DB construct containing U87, in combination with FITC-labeled Ker-AuNPs after 0, 24, and 56 h of culture. The cells were stained Supplementary Video with DiI (red), while the Ker-AuNPs were detected in green. Nuclei were stained with Hoechst (blue). Scale bars represent 150 μm.

