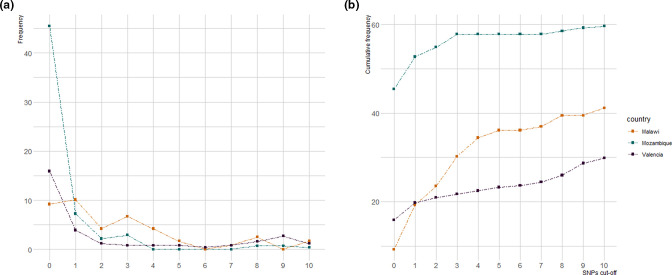
Fig. 3.
Proportion of strains linked by pairwise distance from 0 to 10 SNPs, using data from three different datasets. (a) Frequency of samples found at each pairwise distance. (b) Cumulative frequency (%) of isolates in transmission at pairwise distance from 0 to 10 SNPs. Colours: the blue line represents data from Mozambique (2013–2014), orange from Malawi (2009) and purple from Valencia (2015).

