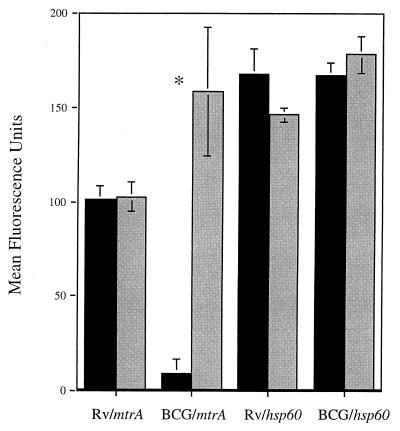
FIG. 4.
Quantitation of fluorescence intensities of mtrA-gfp and hsp60-gfp fusions in M. tuberculosis H37Rv and M. bovis BCG infecting J774 cells. Mean fluorescence intensities (± the standard errors) were determined as described in Materials and Methods. Macrophages were infected for 2 h (black bars) or 3 days (grey bars) with M. tuberculosis H37Rv or M. bovis BCG Pasteur carrying the pmtrA-gfp or phsp60-gfp reporter plasmid. ∗, significant difference in fluorescence intensity (P < 0.05 by ANOVA).

