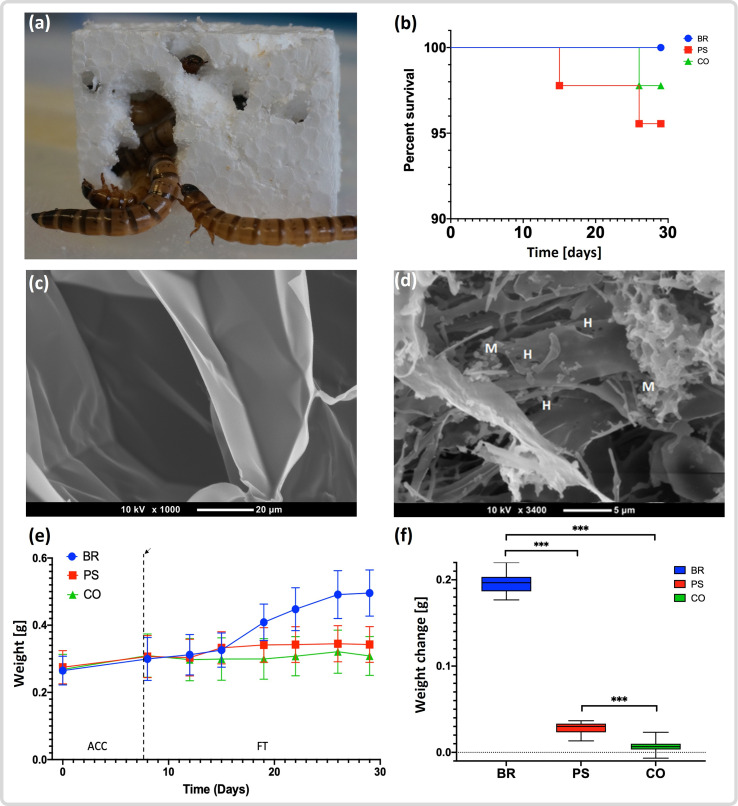
Fig. 1.
Superworm polystyrene utilization, survival rates and weight changes. (a) A group of superworms eating their way into a polystyrene block. (b) Superworm survival rates for the three groups: bran (BR, blue), polystyrene (PR, red) and the starvation control group (CO, green) during the duration of the 3 week feeding trial. (c) Scanning electron micrograph of the extruded polystyrene (styrofoam) as supplied by the manufacturer. (d) Polystyrene particle recovered from the gut of a superworm in the PS group. Note several holes (H), and microbial cells (M). (e) Weight change of the superworms in the three groups. Day 1 to day 7 represents the acclimatization period (ACC) and the end of the ACC is indicated by a dashed line. (f) Overall weight change of the superworms in each group at the end of the feeding trial. Asterisks indicate that the weight change between BR and PS, BR and CO, and PS and CO was significantly different (Table S3). Box plots show the median (bold line), first and third quartile (box outline), 10th and 90th percentile (lower and upper whisker boundaries), and outliers (circles).

