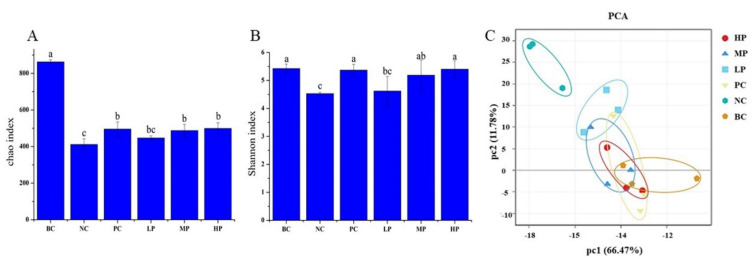
Figure 4.
The analysis of abundance and diversity of the gut microbiota: (A) Chao index; (B) Shannon index; (C) principal component analysis (PCA) score plot. BC (blank control) represents healthy mice; NC (negative control) represents AAD mice without treatment; PC (positive control) represents AAD mice administrated with 200 mg/kg BW of inulin; LP, MP and HP represent AAD mice administrated with low-dosage (100 mg/kg BW), middle-dosage (200 mg/kg BW) and high-dosage (400 mg/kg BW) of BSP, respectively. a–c: Graph bars marked without the same letters differed significantly (p < 0.05). The values are expressed as means ± S.D.

