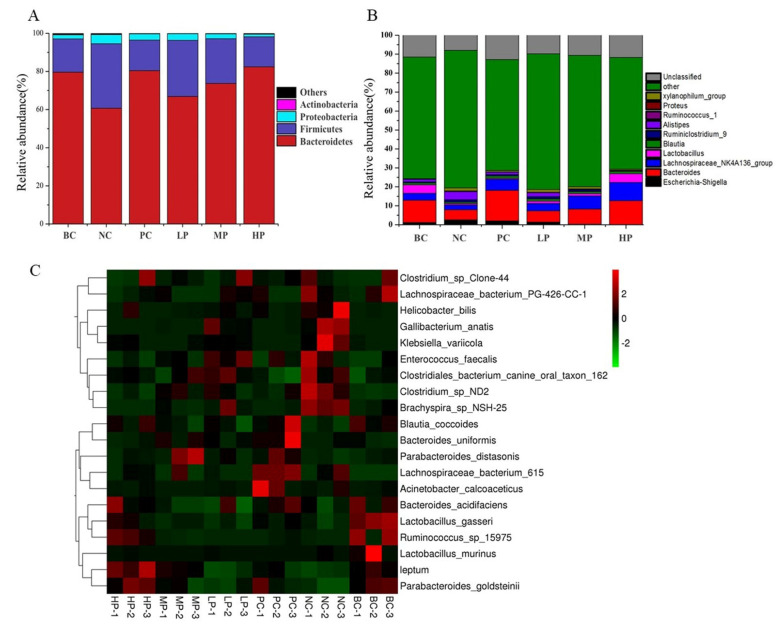
Figure 5.
Composition of the gut microbiota represented by the stacking histograms at phylum level (A) and genus level (B), as well as a heatmap at species level (C). BC (blank control) represents healthy mice; NC (negative control) represents AAD mice without treatment; PC (positive control) represents AAD mice administrated with 200 mg/kg BW of inulin; LP, MP and HP represent AAD mice administrated with low-dosage (100 mg/kg BW), middle-dosage (200 mg/kg BW) and high-dosage (400 mg/kg BW) of BSP, respectively.

