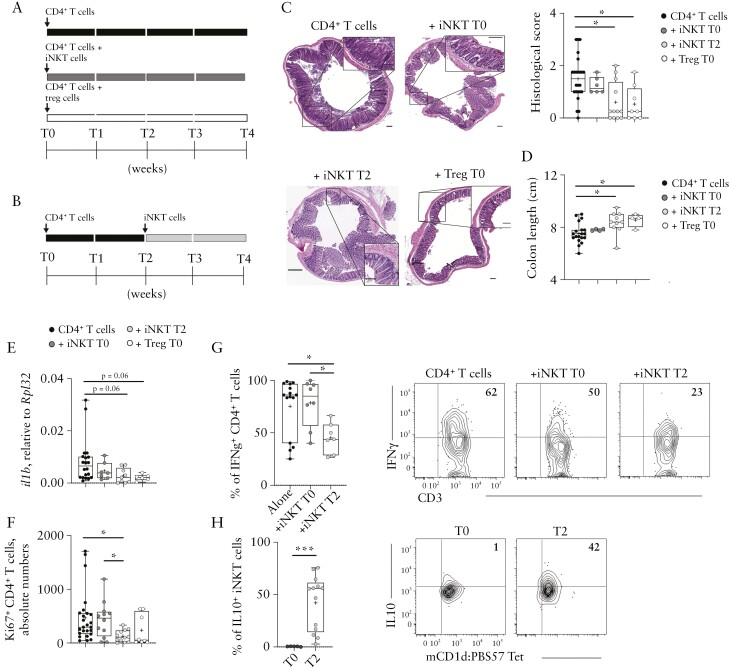
Figure 2.
iNKT cells suppress colitogenic CD4+T cells in vivo. [A, B] Schematic representation of the experiment.[C] H&E staining [C, left, scalebar 100 µm] and cumulative histological score [C, right], [D] colon length, [E] Il1β colonic expression, and [F] Ki67+CD4+ T cells absolute numbers in colon specimens of the indicated experimental groups. [G] Representative dot plots and cumulative frequency of IFNγ-producing colonic CD4+ T cells and [H] IL10-producing colonic iNKT cells. Statistical significance was calculated using the Kruskal-Wallis test corrected for multiple comparisons by controlling the false-discovery rate [FDR]; *p ≤0.05, **p ≤0.01, ***p ≤0.001. H&E, haematoxylin and eosin.

