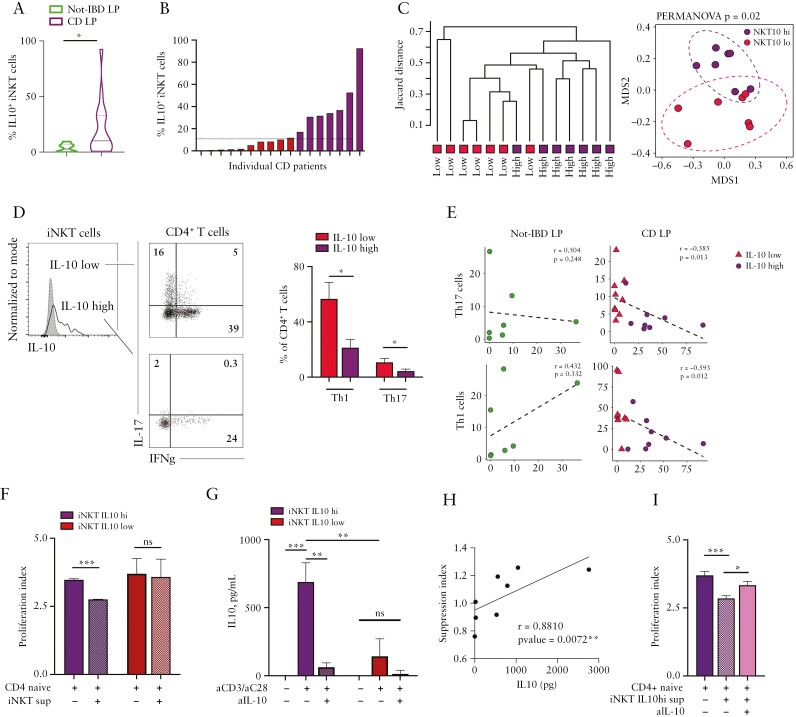
Figure 4.
Intestinal NKT10 cells derived from CD patients suppress naïve CD4+ T cell proliferation through IL10 production. [A] Frequency of IL10+ iNKT cells among intestinal LPMC of non-IBD patients [green, n = 7] and CD patients [purple, n = 17]; *p ≤0.05, Mann-Whitney U test. [B] Individual IL10+iNKT cells abundance in LPMC of CD patients [red bars, NKT10-low patients; purple bars, NKT10-high patients]; the horizontal line indicates the median IL10+iNKT frequency used to stratify patients according to NKT10, i.e., NKT10-high and -low. [C] Hierarchical clustering and multidimensional scaling analysis of immunophenotyped NKT10-high and -low CD patients were calculated by samples’ distance similarities [Jaccard index] from LPMC FACS analysis on TNF+, IFNγ+, IL17+, IL10+iNKT, and CD4+T cells. [D] Representative dot plots [left] and cumulative histograms [right, n = 17 CD patients] of Th1 and Th17 CD4+ T cell frequency in NKT10-high and -low CD patients. [E] Spearman correlation analyses between IL10-producing iNKT cells and Th17 [upper panels] or Th1 [lower panels] cell frequencies in non-IBD LPMC [left plots] and CD LPMC [right plots]. [F] Proliferation indexes of naïve CD4+ T cells exposed to supernatants of aCD3/aCD28-stimulated iNKT cell lines isolated from the LP of iNKT10-high [purple bars] and -low [red bars] CD patients. [G] IL10 protein concentration in the supernatants of unstimulated or aCD3/28-stimulated iNKT cell lines isolated from the LP of NKT10-high [purple bars] and -low [red bars] CD patients in the presence or absence of IL10 blocking antibodies. [H] Two-tailed Spearman’s correlation test between IL10 protein concentration and suppression indexes. [I] Proliferation indexes of naïve CD4+ T cells exposed to supernatants of aCD3/aCD28-stimulated iNKT cell lines isolated from the LP of NKT10-high CD patients in the presence or absence of IL10 blocking antibodies. Statistical significance was calculated using the one-way ANOVA test corrected for multiple comparisons by controlling the false-discovery rate [FDR]; *p ≤0.05, **p ≤0.01, ***p ≤0.001. LPMC, lamina propria mononuclear cells; IBD, inflammatory bowel disease.

