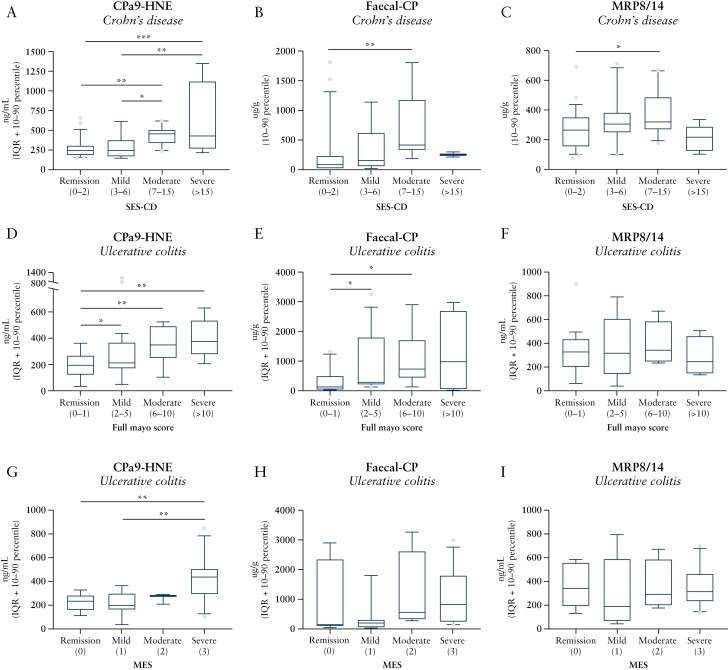
Figure 4.
Biomarker levels of CPa9-HNE, faecal CP, and MRP8/14 serum calprotectin stratified according to endoscopic disease severity based on the A-C] SES-CD for Crohn’s disease [n = 54], D-F], full Mayo score for ulcerative colitis [n = 43], and G-I] MES score for ulcerative colitis [n = 30]. Data are depicted as interquartile range [IQR] with 10–90 percentile. Statistical differences were calculated using one-way ANOVA, *p < 0.05, **p < 0.01, ***p < 0.001. CP, calptotectin; ANOVA, analysis of variance; SES-CD, Simple Endoscopic Score for Crohn’s Disease; MES, Mayo Endoscopic Score.

