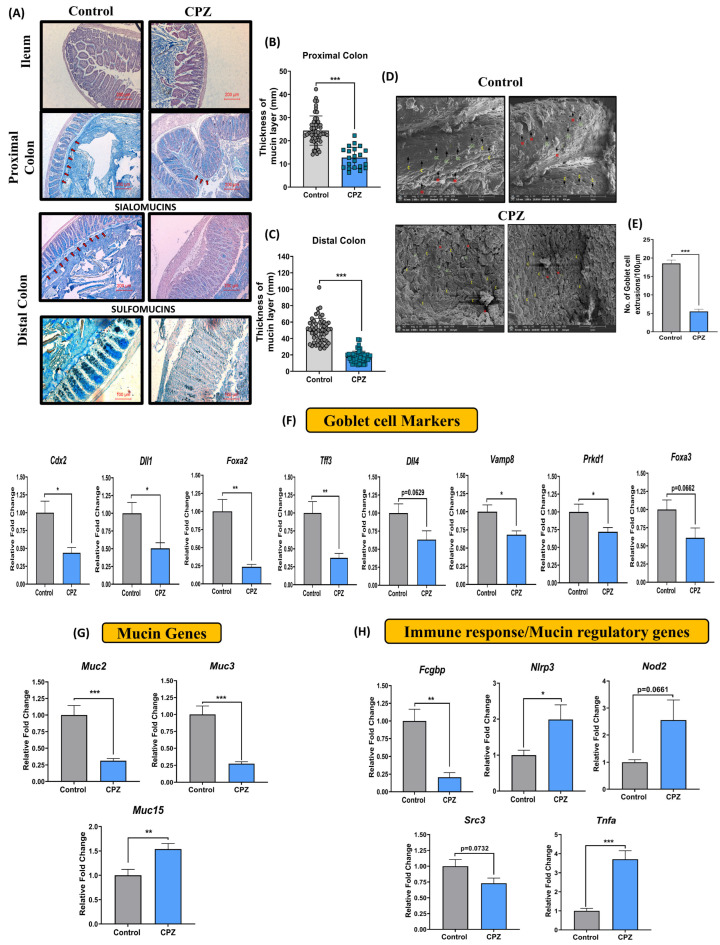
Figure 1.
Effect of CPZ rectal administration on colonic mucus production. Histology representative images of (A) Hematoxylin and Eosin—Alcian blue staining in ileum, proximal, and distal colon (n = 3), High iron diamine—Alcian blue staining in distal colon (n = 3), (B) thickness of mucus layer in proximal colon, (C) thickness of mucus layer in distal colon. (D) representative images for SEM of colon tissues and (E) number of colonic mucus extrusion (n = 3). Gene expression analysis for (F) Goblet cell markers, (G) mucin genes and (H) immune response/mucus regulation in colon (n = 6). Mice were divided into two groups—Control (administered vehicle rectally) and CPZ (administered 531 µM CPZ rectally). Treatment was given for two weeks. After sacrifice, colon tissues were fixed in Carnoy’s solution, subjected to serial dehydration with gradient ethanol (25%, 50%, 75%, 90% and twice in 100%) 2 h each followed by clearing in xylene (1 h twice). The colon tissues were embedded in paraffin and 5 µm sections were cut. For staining, the sections were deparaffinized in xylene (5 min, twice) followed by rehydration in gradient ethanol (100% twice, 90%, 70%, 50%, 25% and PBS, 2 min each). The samples were treated with respective stains (H&E: 2 min each, AB: 15 min, HID: 18 h, AB: 30 min) followed by washing (5 min, thrice after each stain) in water. Sections were dehydrated, treated with xylene, and mounted with DPX mounting medium. Microscopy was performed for imaging and mucus thickness was measured using Imagescope. For H&E-AB staining, images were captured at 10× and, for HID-AB staining, images were captured at 20×. The mucus layer in H&E-AB stain tissues is presented with red arrows in the figure. For SEM, colon sections were cut open (lumen was exposed) and fixed in 2.5% glutaraldehyde. Then, the tissues were washed with PBS (15 min, thrice at 4 °C). The tissues were post-fixed in 1% osmium tetroxide for 2 h and again washed with PBS (15 min, thrice at 4 °C). The tissues were then serial dehydrated in acetone (30%, 50%, 70%, 90%, 95%, 100%, 30 min at 4 °C). The samples were air dried and spur-coated with gold (10 nm) images were taken on a scanning electron microscope at 1000×. In SEM image analysis, (M in red) depicts colonic mucus extrusions, (GC in green) depicts goblet cells, and (C in yellow) depicts crypts of the colon. The mucus extrusions were counted using Imagescope. For gene expression studies, RNA was extracted from colon tissues and gene expression was performed for goblet cell markers, mucin genes, and genes involved in immune response and mucus regulation using an Nanostring nCounter multiplex gene expression assay. All data are represented as mean ± SEM. Intergroup variations were assessed using a Student’s unpaired t-test. * p < 0.05, ** p < 0.01, *** p < 0.001 versus Control.

