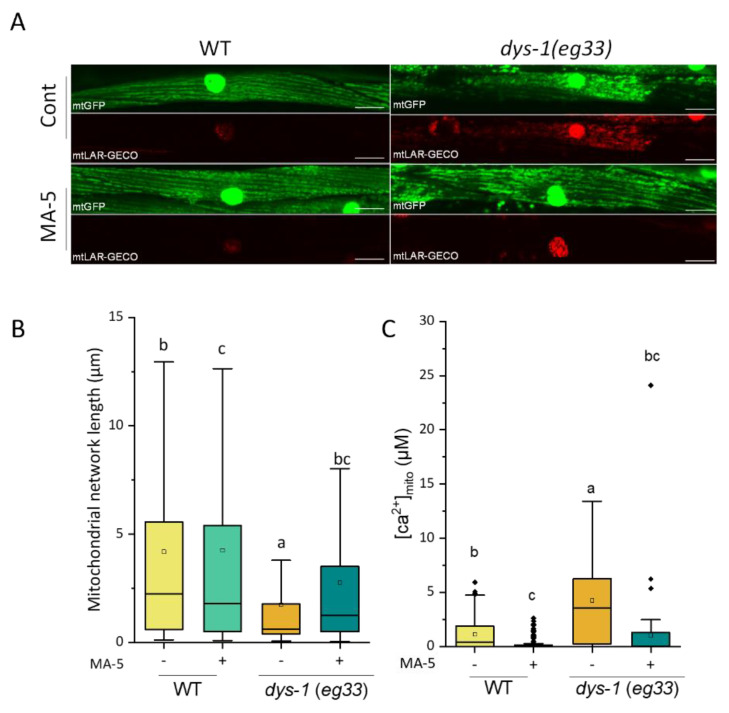
Figure 3.
MA-5 suppressed DMD disease model symptoms on mitochondrial fragmentation and mitochondrial Ca2+ levels increase. (A) Representative images of the mitochondrial morphologies (indicated as green), mitochondrial calcium signal (indicated as red) and merged observed. (Scale bar: 20 µm). Transgenic C. elegans dys-1(eg33) null mutant ATU3305 expressing mitochondria-targeted GFP (mtGFP) and mitochondrial calcium-targeted LAR-GECO (mtLAR-GECO) in body wall muscle cells were monitored on day 2 of adulthood. (B) The mitochondria network length in each muscle cell (n ≥ 900 mitochondria from 5–7 worms/treatment) treated with or without MA-5 of 2-day-old ATU3305 adults. Different letters indicate significant differences (p ≤ 0.05) by Dunn’s test. (C) Concentration of mitochondrial calcium in worms (n ≥ 60 from 6–12 worms/treatment). Different letters indicate significant differences (p ≤ 0.05) by Dunn’s test with all data points including outliers. Data are shown as box plots to indicate median (central line) and mean (square mark). Cont: control treated with 0.1% DMSO; MA-5: 10 μM; WT: wild type (strain ATU3301); Diamond mark: outlier data.

