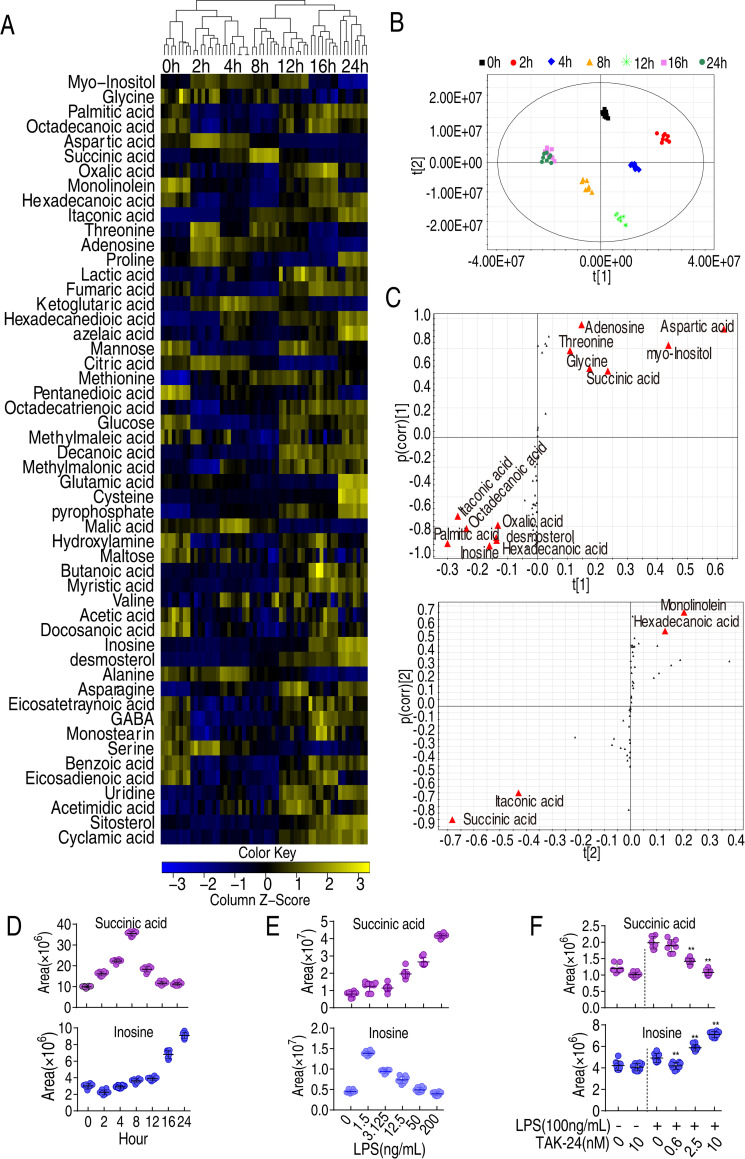
Fig 2. Dynamic changes in metabolomes of LPS-induced phagocytes.
A, Heatmap showing abundance of metabolites in macrophages treated with LPS for the indicated length of time. B, PCA analysis of data shown in (A). Data from each time point are represented as a cluster, coded by color for each time point (see legend at top of panel B. C, S-plot generated from OPLS-DA, displaying metabolites of interest D, Relative abundance of succinate and inosine at the indicated time points after exposure to LPS. E, Relative abundance of succinate and inosine in RAW264.7-asc cells exposed to LPS at the indicated concentration for 8 h. F, Relative abundance of succinate and inosine of RAW264.7-asc cells in the presence of TLR4 inhibitor TAK-24.

