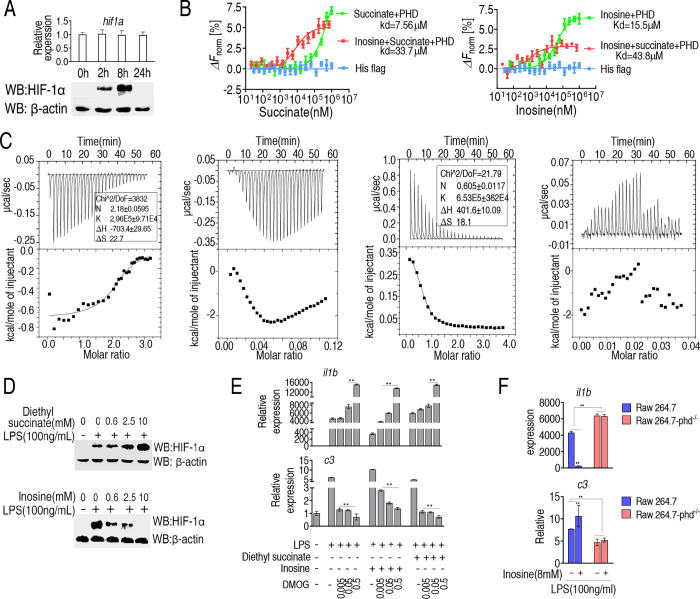
Fig 4. Interactions between PHD, succinate and inosine and impact on HIF 1-α protein abundance.
A, qRT-PCR for transcript abundance and Western blot for abundance of HIF 1-α protein at the indicated time points after treatment with LPS. B, MST analysis of PHD plus succinate and/or inosine. C, ITC curves for the binding of succinate (the first panel) or in the presence of inosine (the second panel) or inosine (the third panel) or in the presence of succinate (the forth panel) to PHD. The top panels showed data obtained from automatic injections after baseline corrections. The bottom panels showed the integrated curve that was fitted into a sequential two-site binding model. K: association constant; N: reaction stoichiometry; ΔS: entropy; ΔH: enthalpy. D, Western blot for HIF 1α protein in the presence of succinate or inosine at the indicated doses plus LPS stimulation. E, Transcripts for il1b and c3 in cells exposed to LPS, inosine, succinate and the indicated concentration of DMOG. F, Effect of PHD knock-out on il1b and c3 expression in LPS-treated macrophages in the presence or absence of exogenous inosine. Results (E-F) are displayed as mean ± SEM, and significant differences are identified (*p < 0.05, **p < 0.01) as determined by non-parametric Kruskal-Wallis one-way analysis with Dunn multiple comparison post hoc test for results.

