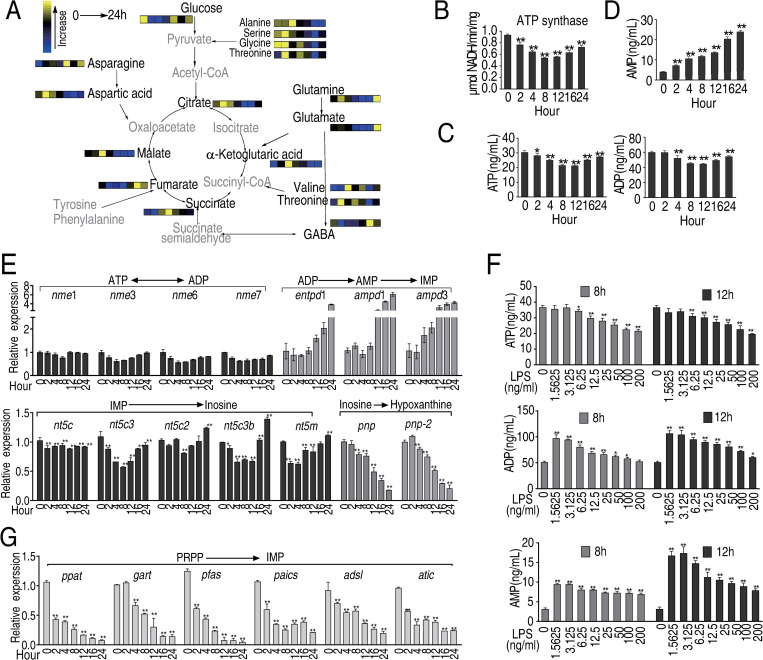
Fig 5. Purine metabolites in LPS-treated macrophages.
A, Summary of the abundance of TCA cycle and purine metabolites at the indicated time points after LPS stimulation, based on data (Fig 2A), B, Quantification of ATP synthase activity at the indicated time points in LPS-treated macrophages C, Quantification of ATP and ADP at the indicated time points after LPS stimulation. D, Abundance of AMP at the indicated time points in LPS-treated macrophages. E, Transcription of genes in the ATP salvage pathway in LPS-treated macrophages F, Quantification of ATP, ADP and AMP at 8 and 12 h after exposure to the indicated concentration of LPS. G. Transcripts of genes involved in de novo ATP synthesis were quantified by PCR. Results (B-G) are displayed as mean ± SEM, and significant differences are identified (*p < 0.05, **p < 0.01) as determined by non-parametric Kruskal-Wallis one-way analysis with Dunn multiple comparison post hoc test for results.

