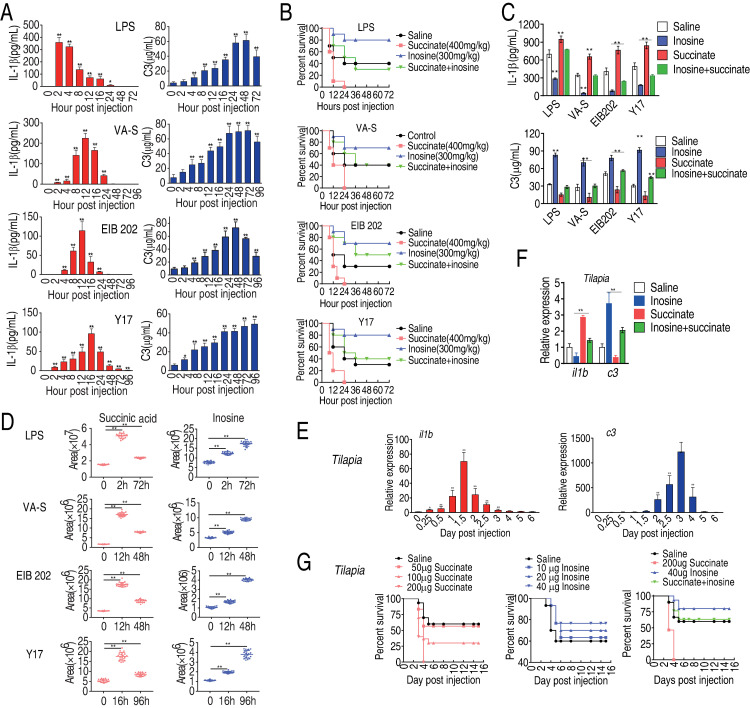
Fig 6. Animal model studies of the impact of succinate and inosine on survival after challenge with bacterial pathogens.
A, Quantification of serum level of IL-1β and C3 in mice at the indicated time points after injection with LPS, V. alginolyticus (VA), E. tarda EIB202 (EIB202) or E. coli Y17 (Y17), as described in Methods. B, Percent survival of mice co-injected with LPS or the indicated bacterial pathogen and succinate or inosine or both, as indicated. C, Serum abundance of IL-1β and C3 in mice co-injected with LPS or the indicated bacterial pathogen and succinate or inosine or both, as indicated. D, Abundance of inosine or succinate at the indicated time point in mice injected with LPS or the indicated bacterial pathogen. E, Abundance of IL-1β and C3 at the indicated time point after injection of tilapia with E. tarda (EIB202), as described in Methods. F, Abundance of IL-1β and C3 in tilapia co-injected with EIB202 and saline, succinate or inosine or both, as indicated. G, Percent survival of tilapia co-injected with EIB202 and the indicated amount of succinate or inosine or both. Results (A-F) are displayed as mean ± SEM, and significant differences are identified (*p < 0.05, **p < 0.01) as determined by non-parametric Kruskal-Wallis one-way analysis with Dunn multiple comparison post hoc test for results (A, C-F) and Kaplan-Meier method with log-rank test (B and G).

