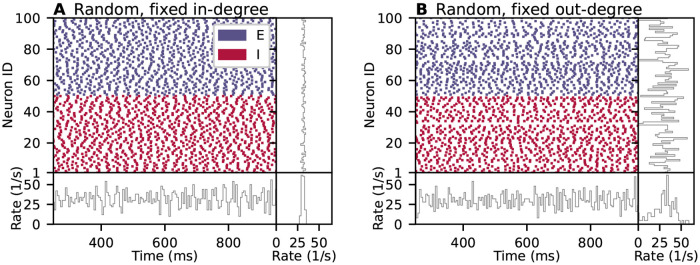
Fig 1. Spiking neuron network simulations of a balanced random network with (A) fixed in-degree and (B) fixed out-degree.
Top left: Raster plots show spike times of 50 out of 10, 000 excitatory (E) and 50 out of 2, 500 inhibitory (I) neurons. Bottom left: Time-resolved spike rate from spike-count histogram across time with temporal bin width of 5 ms. Top right: Per-neuron spike rate from spike-count histogram for individual neurons. Bottom right: Normalized distribution of per-neuron spike rates with bin width of 2/s. Model details are given in Section “Materials and methods”.

