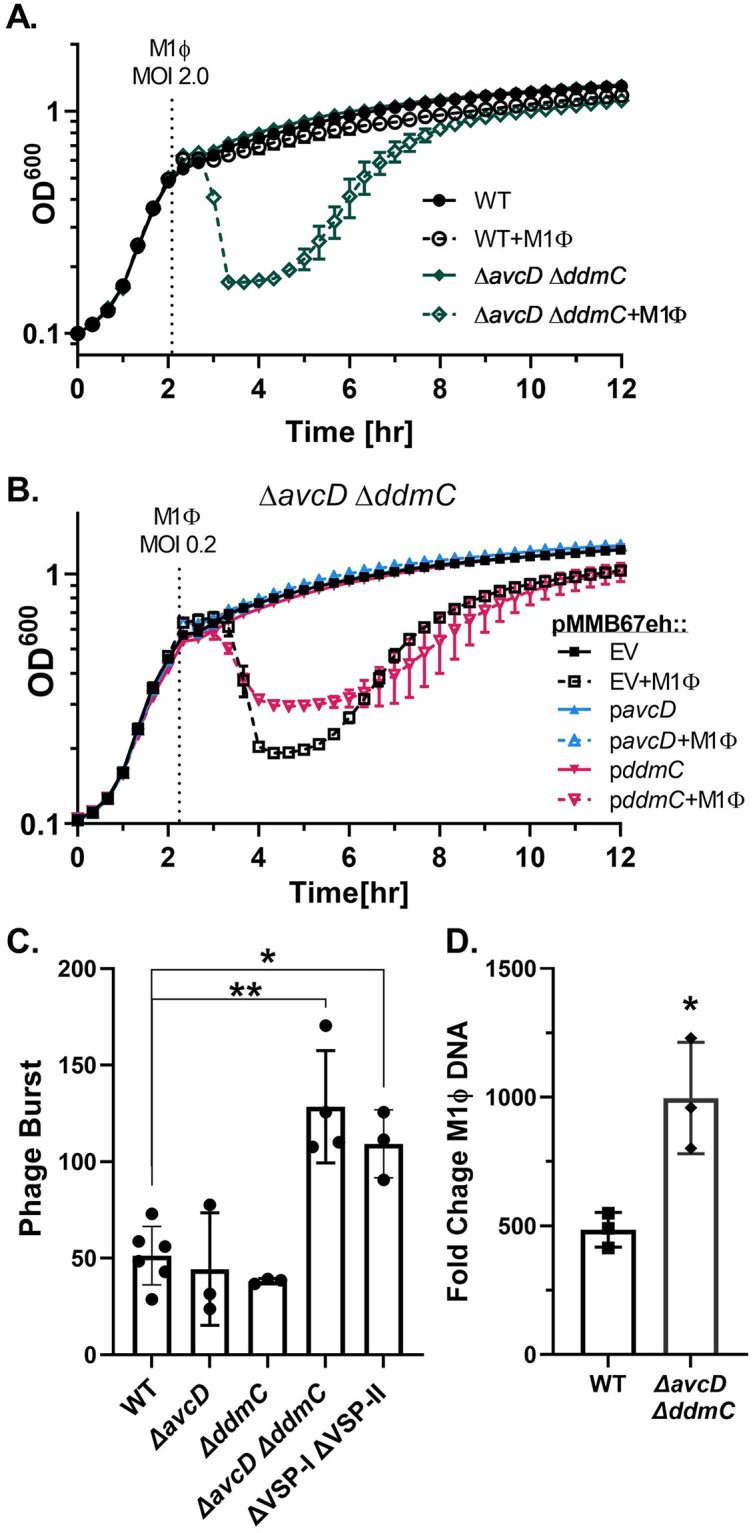
Fig 3. avcD and ddmC protect growing cultures of V. cholerae from M1Φ infection.

(A) Growth and lysis curves of V. cholerae. Indicated strains were infected with M1Φ at an MOI of 2.0 at the time displayed by the dotted line. All strains were grown in LB shaking at 37°C and optical density was read at regular intervals with a plate reader. (B) V. cholerae ΔavcD ΔddmC strain containing the plasmid pMMB67eh or the same plasmid expressing avcD or ddmC was grown and infected with M1Φ at an MOI of 0.2. (C) Phage burst assays. Strains were grown to mid-log phase before being infected with phage at an MOI of 0.1. After a period of absorption cultures were further diluted 1/2500,1/25000, and 1/250000. Burst is calculated by dividing the total output phage by absorbed phage (T0-T10). Strains are indicated on the x-axis. P-values were determined by Unpaired T-tests with Welch’s correction and significance shown as *p<0.0332 and **p<0.0021. (D) Fold change in M1Φ genome copy through infection. The indicated strain was grown to mid-log phase before being infected with M1Φ at an MOI of 0.02 and grown in LB at 37°C on a roller. Immediately upon infection and at 20 minutes post infection a portion of the culture was removed and boiled. The boiled culture was then diluted 1:50 and used as template for qPCR with primers targeting the ICP3 DNA polymerase. Fold change was calculated by dividing the CT value at 20minutes by the value at 0 minutes for each culture.
