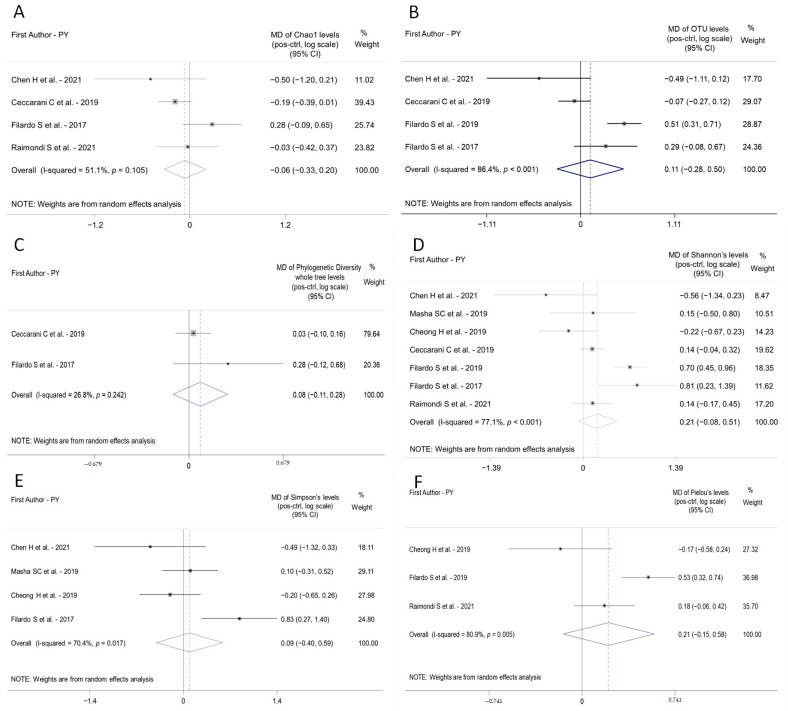
Figure 2.
Forest plot displaying the results of the meta-analyses of studies reporting data about each Alpha-Diversity parameter in the positive group (pos) and healthy controls (ctrl). (A), Chao1; (B), OTU number; (C), Phylogenetic diversity whole tree; (D), Shannon; (E), Simpson; (F), Pielou’s evenness). The point estimated by each study (Mean Difference on logarithmic scale between pos and ctrl, MD) is represented by a square and the horizontal line is the 95% Confidence Interval (95% CI). The area of the square reflects the weight that the study contributes to the meta-analysis. The combined-effect MD and its 95% CI are represented by the diamond. The vertical line represents the line of no difference. CI, confidence interval; MD, Mean Difference; PY, Publication Year. See Refs. [22,23,24,25,26,27,28].

