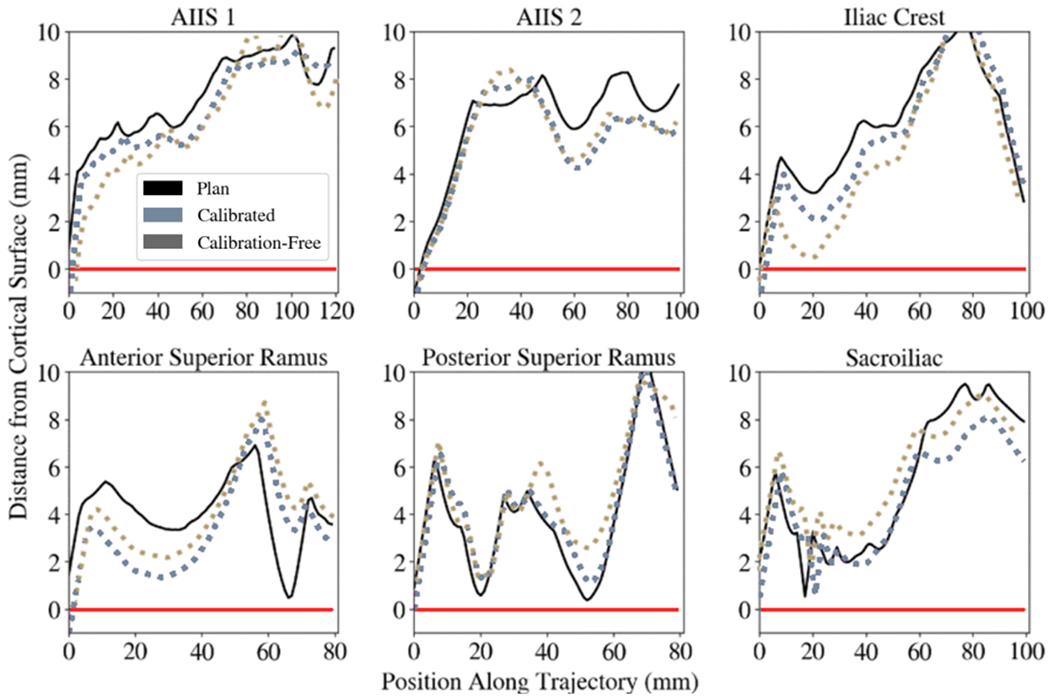
Figure 5.

Distance of simulated K-wires from the cortical bone surface. A K-wire mesh model was propagated along the aligned drill guide and the distance of the K-wire mesh model to a mesh model of the cadaver pelvis was evaluated at discrete positions along the length of the K-wire model. Values below the red line (y=0) indicate breaches of the simulated K-wire out of the cortical bone. Positive values indicate conformance of the simulated K-wire within the bone corridor. Six trajectories with various approaches in the pelvis were planned and executed. The black curve shows the preoperative trajectory plan and its distance to the cortical bone surface along the length of the trajectory. The light blue curve shows the calibrated workflow and its cortical bone distance, while the gray curve shows the calibration-free workflow.
