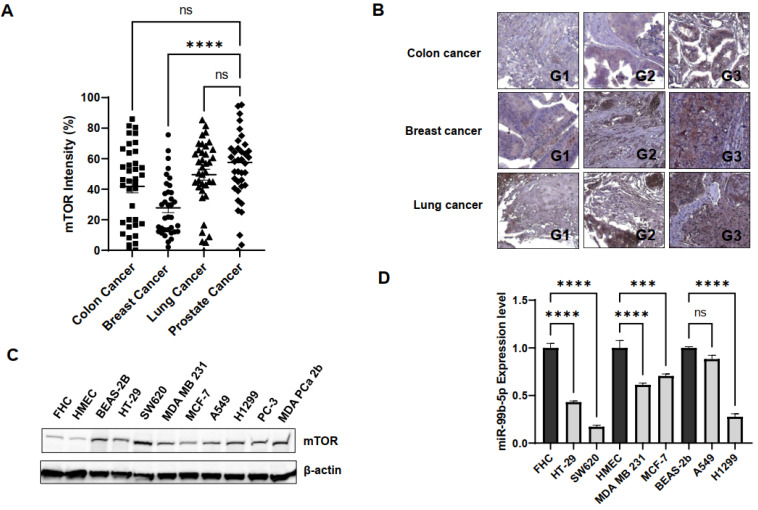
Figure 4.
mTOR and miR-99b-5p expression profiles in colon, breast, and lung cancer cell models. (A) Quantification of mTOR intensities in colon, breast, lung, and prostate cancer specimens using IHC staining assay. IHC staining assay was applied to examine mTOR protein levels in various solid tumor patient specimens on a TMA slide. Significantly different mTOR intensities were identified in PCa vs. breast cancer specimens (**** p-value < 0.0001, based on ANOVA with Dunnett’s post-hoc test). No significant difference (ns) in mTOR intensities was found in colon cancer vs. PCa, or lung cancer vs. PCa specimens. (B) Representative IHC staining images of the mTOR protein in colon, breast, and lung cancer specimens. Apparently, the expression levels of mTOR were gradually increased from low- to high-grade cancer samples. G1: grade 1 tumor, G2: grade 2 tumor, and G3: grade 3 tumor. (C) Western blot analysis of mTOR protein levels in a panel of normal and cancer cell lines. Representative Western blot analysis of mTOR protein levels from total protein extracts of colon cancer (HT-29, SW620), breast cancer (MDA MB 231, MCF-7), lung cancer (A549, H1299), and PCa (PC-3, MDA PCa 2b) cell lines and control cell lines (FHC, HMEC and BEAS-2B from normal colon, breast and lung tissues, respectively). (D) RT-qPCR assays showed downregulation of miR-99b-5p in colon, breast and lung cancer cell lines, compared to their normal controls. RNA samples isolated from FHC, HMEC, HT-29, SW620, MDA MB 231, MCF-7, BEAS-2B, A549, and H1299 were subjected to RT-qPCR assays of miR-99b-5p. Significantly different miR-99b-5p expression levels (**** p-value < 0.0001 and *** p-value < 0.001, based on ANOVA with Tukey’s post-hoc test) were shown in cancer cell lines vs. normal controls (except A549 vs. BEAS-2B). ns: not significant. Each value was represented as mean ± SEM, obtained from three independent cDNA samples with duplicate or triplicate qPCR reactions. ns: not significant.

