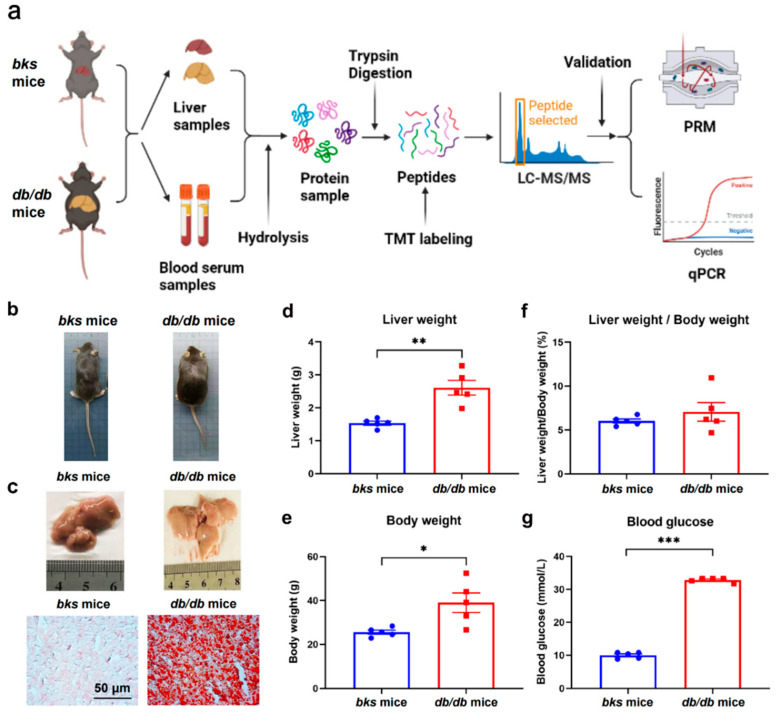
Figure 1.
Study workflow and the validation of the genetic NAFLD mouse model. (a) Workflow chart; (b) Representative phages of db/db and bks mice (n = 5); (c) Representative liver phages and the corresponding Oil Red O staining of bks and db/db mice; (d) Liver weight, (e) body weight, (f) ratios of liver and body weight and (g) blood glucose of db/db mice and bks control group. Red dots represent bks mice and blue squares represent db/db mice. * p < 0.05; ** p < 0.01; *** p < 0.001.

