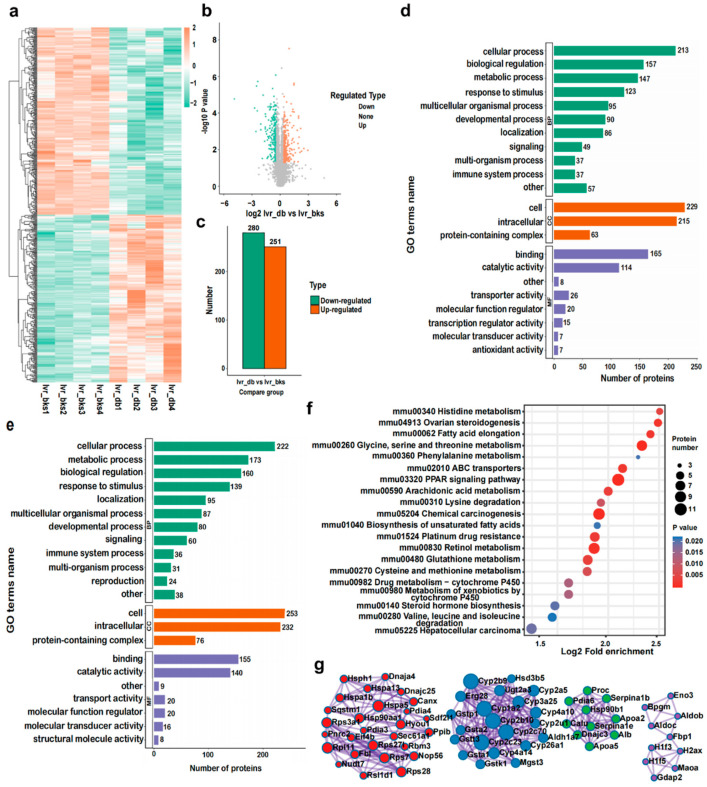
Figure 4.
Identification and bioinformatics analysis of hepatic DEPs in db/db mice compared with bks mice. (a) Heatmap, (b) volcano, and (c) histogram depicting the distribution of the hepatic DEPs in db/db mice compared with bks mice. GO (BP) analysis of (d) the upregulated proteins and (e) downregulated hepatic proteins in db/db mice compared with bks mice. (f) KEGG pathway analysis of upregulated DEPs in the mouse liver. (g) PPI network of the optimized upregulated and downregulated DEPs in the mouse liver.

