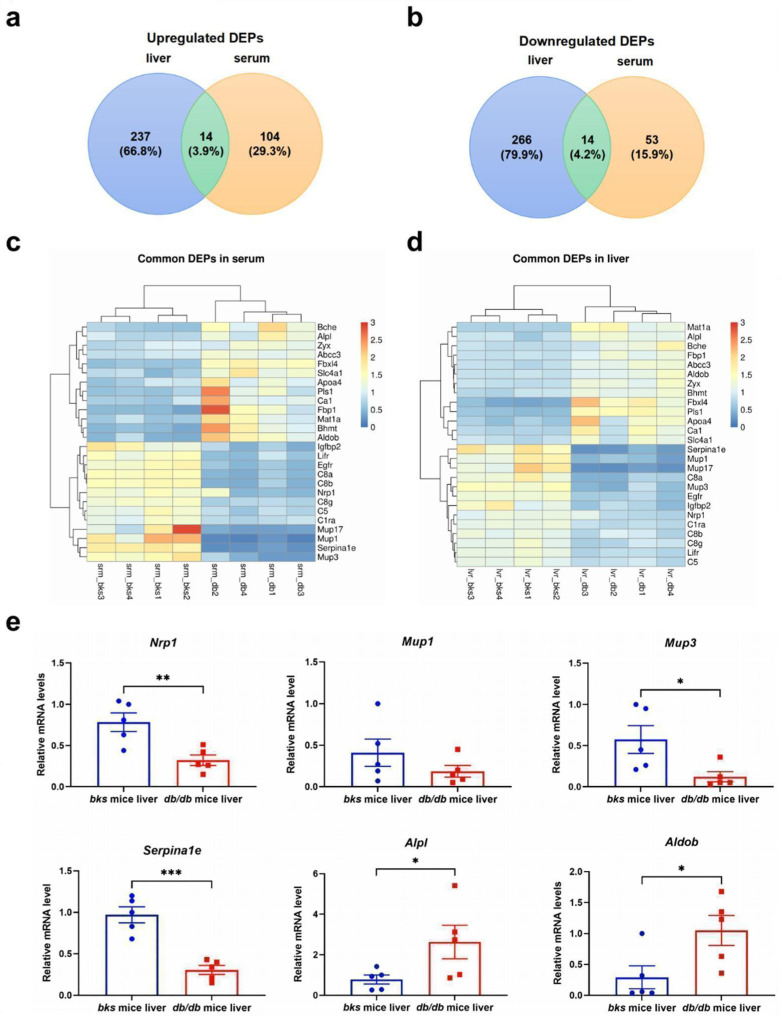
Figure 5.
The confirmation of common DEPs in the sera and livers of db/db mice. (a) Commonly up-regulated DEPs in the sera and livers of db/db mice and bks mice (n = 5). (b) Commonly downregulated DEPs in the sera and livers of db/db mice and bks mice (n = 5). (c) Heatmap of the commonly upregulated DEPs. (d) Heatmap of the commonly downregulated DEPs. (e) The validations of some of the common DEPs. Red dots represent bks mice and blue squares represent db/db mice. * p < 0.05; ** p < 0.01; *** p < 0.001.

