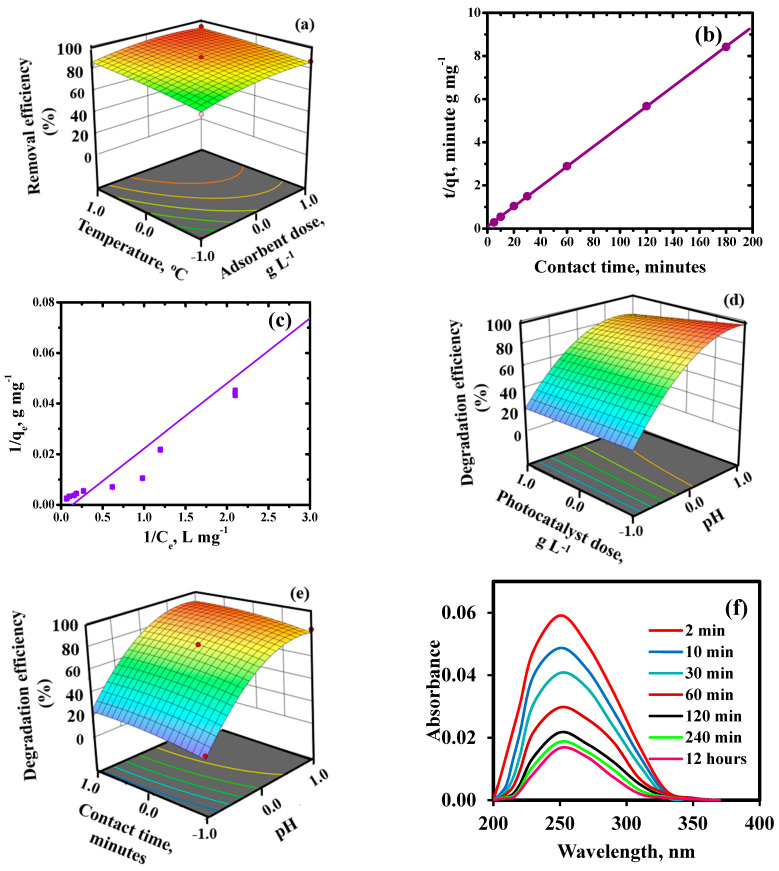
Figure 7.
Removal efficiency of Pb(II) as a function of adsorbent dose and temperature (a), Pseudo–second order kinetic model (b), Langmuir adsorption isotherm (c), Degradation efficiency of malathion as a function of (d) pH and adsorbent dose, (e) pH and contact time and (f) temporal plots of malathion degradation. In b & c, straight lines represents fitting of model, where Ce stands for equilibrium concentration, qe and qt represents uptake capacity at equilibrium time “t” and at time “t”, respectively.

