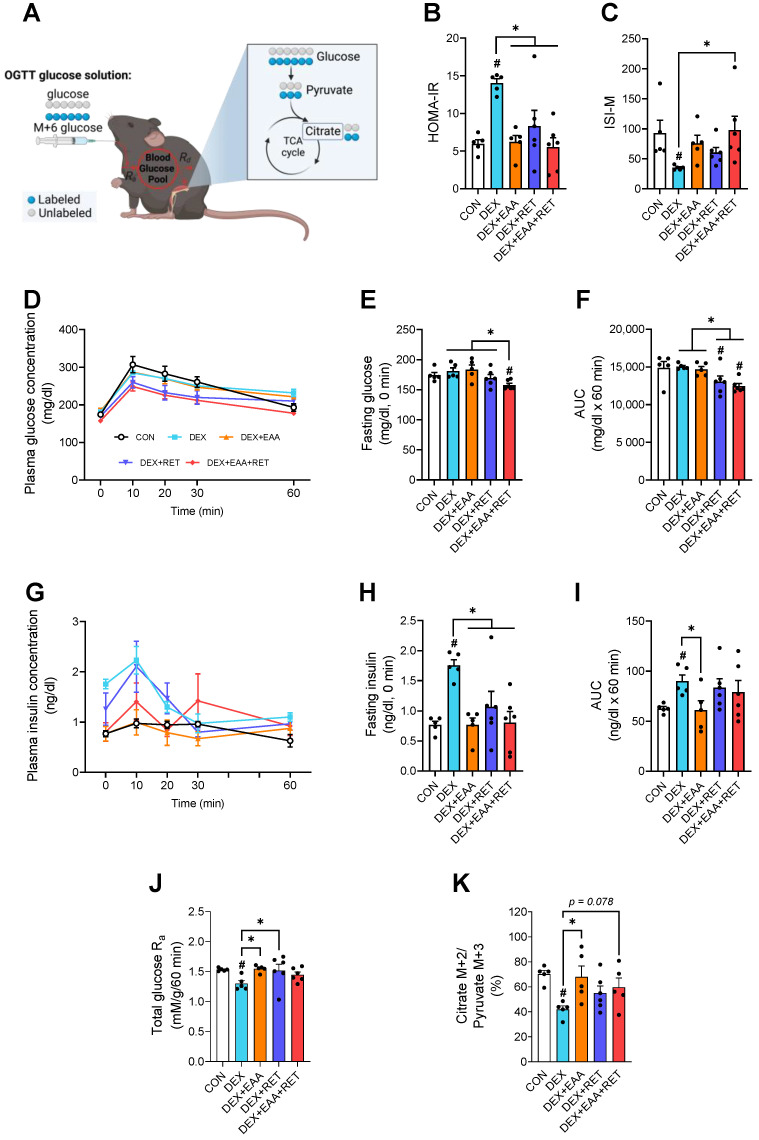
Figure 6.
Combined treatment of EAA and RET completely restores impaired insulin sensitivity by DEX treatment. (A) Schematic showing glucose flux in vivo at systemic and myocellular levels using U-13C6 glucose tracer during OGTT. This figure was created with BioRender.com. (B) HOMA-IR index (n = 5–6). (C) Matsuda insulin sensitivity index (n = 5–6). (D) Plasma glucose concentration during the OGTT (n = 5–6). (E) Plasma glucose concentration at fasting state over 6 h (n = 5–6). (F) Area under the curve of plasma glucose concentration during OGTT (n = 5–6). (G) Plasma insulin concentration during the OGTT (n = 5–6). (H) Plasma insulin concentration at fasting state over 6 h (n = 5–6). (I) Area under the curve of plasma insulin concentration during OGTT (n = 5–6). (J) Total plasma glucose appearance during OGTT (n = 5–6). (K) Glucose flux into the Krebs cycle, reflected as the ratio of citrate M+2 to pyruvate M+3 in gastrocnemius muscle. Data are presented as mean ± S.E. # Significant difference from control group (p < 0.05). * Significant difference between labelled groups (p < 0.05). CON, sedentary control; DEX, dexamethasone; EAA, essential amino acids; RET, resistance exercise training; HOMA-IR, homeostasis model assessment of insulin resistance; ISI-M, Matsuda–DeFronzo insulin sensitivity index; AUC, area under the curve; glucose Ra, rate of plasma glucose appearance.

