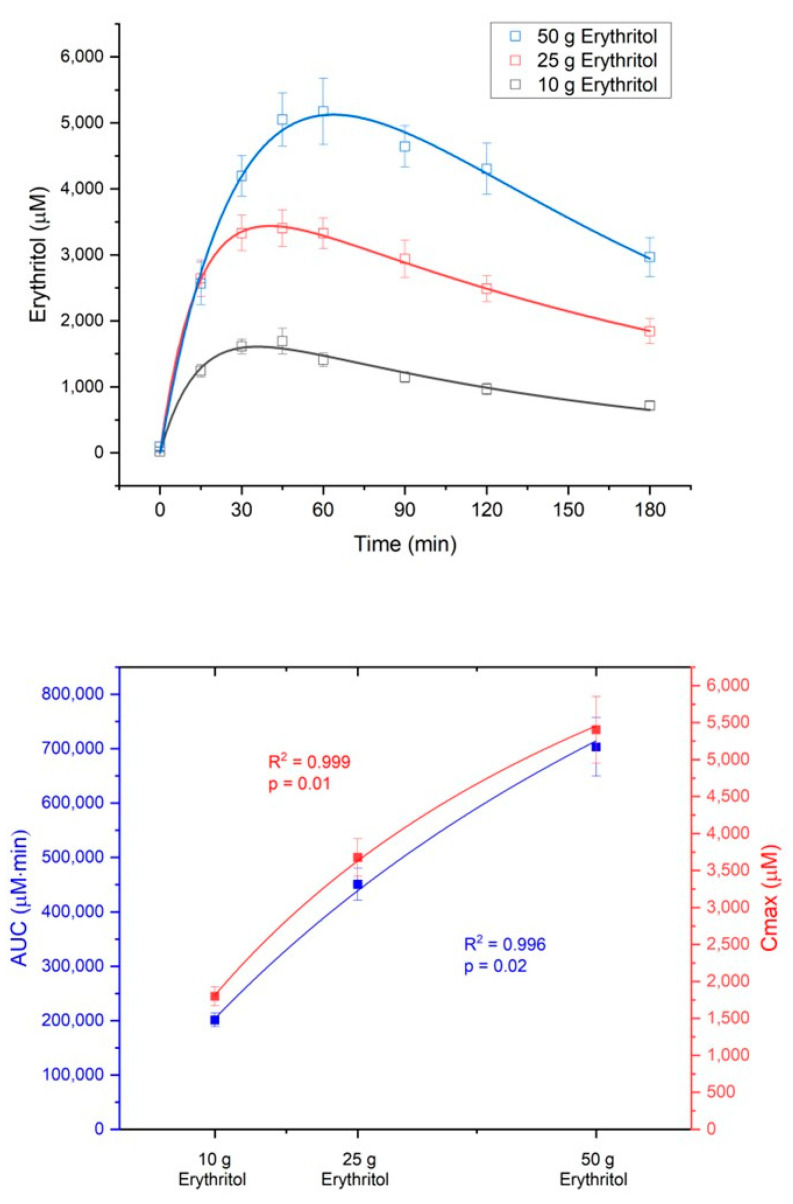
Figure 2.
Dose-dependent absorption of erythritol. Upper part: concentration–time curves after administration of the three loads; lower part: dose-response for the area under the curve from 0 to 180 min (AUC180) and the maximum deviations from baseline (Cmax). Data are expressed as mean ± SEM. Data were best fit with a non-linear dose-response model.

