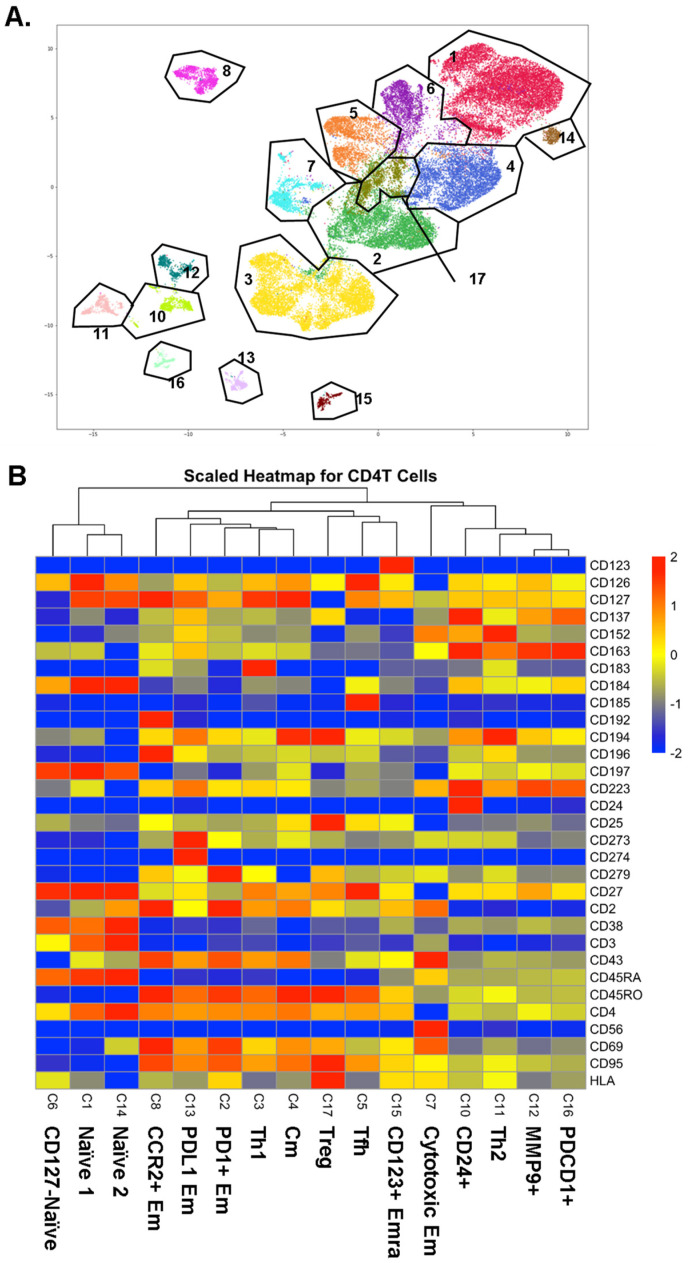
Figure 1.
(A) CD4+ T cells were UMAP–Louvain-clustered by all non-negative surface markers. CD4+ T cells formed 16 clusters; gates (black lines) overlaid and cluster numbers indicated. (B) Scaled (log2) heatmaps of antibody expression in each CD4+ T cell cluster. Cluster numbers correspond to panel A; cluster names indicated. Mean expression: yellow, highest: red, lowest: blue.

