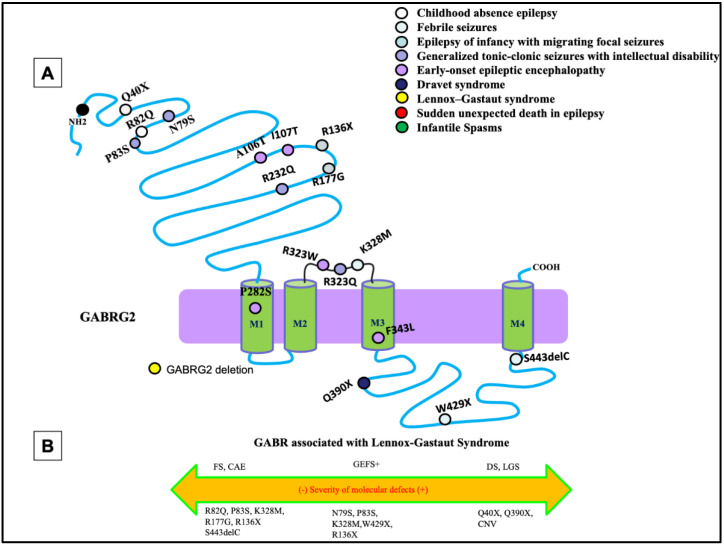
Figure 3.
Epilepsy phenotypes associated with GABRG2 mutations. (A) Two-dimensional protein topology of the γ2 subunit showing locations of mutations in human GABRG2 associated with various epilepsy syndromes and neurodevelopmental disorders. Each mutation is color coded to indicate associated diagnosis, and each dot represents the relative location on the γ2 subunit protein peptide. (B) Diagram dictating the severity of each mutation on a continuum of epilepsy phenotypes. The left side of the diagram infers a less severe epileptic phenotype, the middle dictates a moderate, and the right side of the diagram infers a more severe epileptic phenotype.

