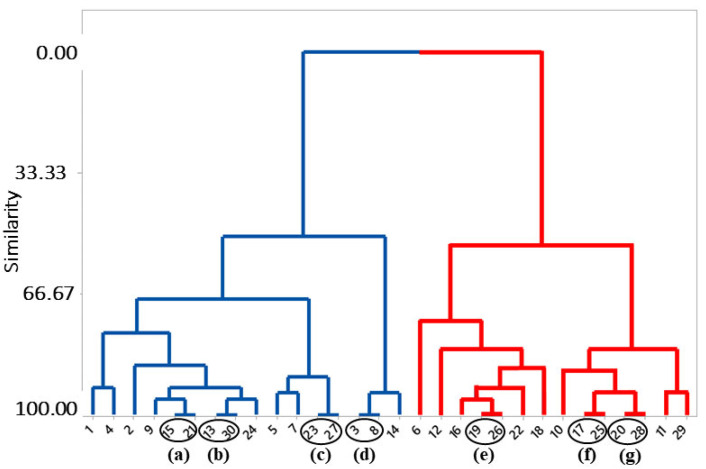
Figure 5.
Hierarchical cluster analysis (HCA) of the structures of n-acyl piperidine compounds. (a) 15/21; (b) 13/30; (c) 23/27; (d) 3/8; (e) 19/26; (f) 17/25; (g) 20/28. In the blue line, the most active structures of the studied group, and in the red line, the least active according to the pharmacophoric model.

