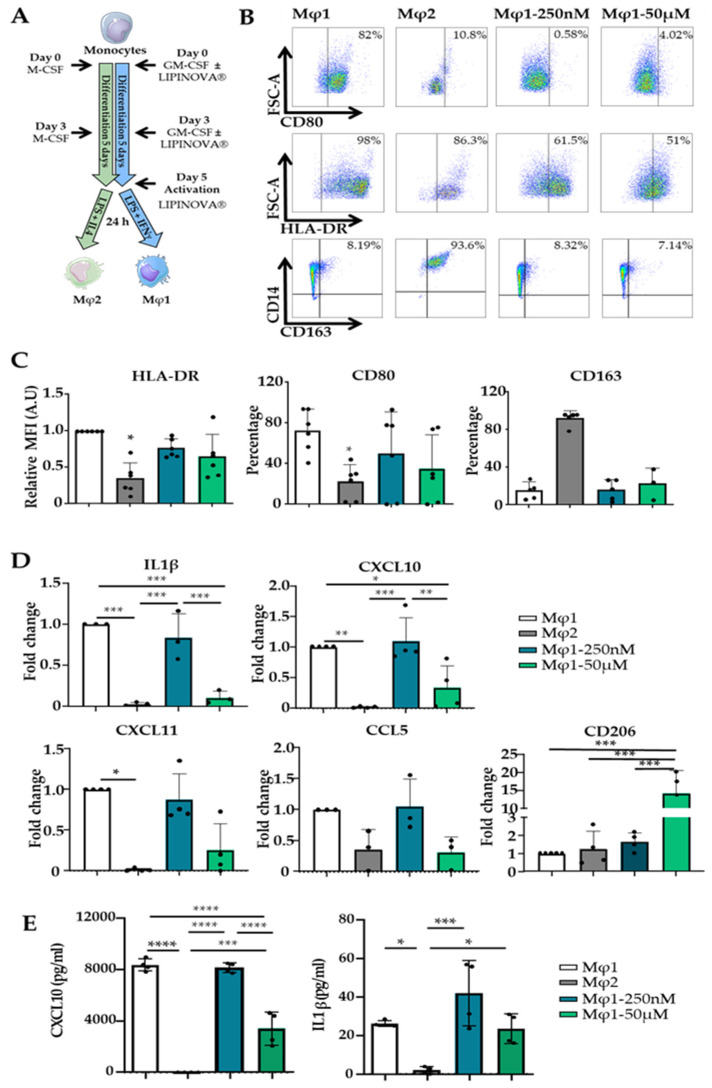
Figure 3.
LIPINOVA® modulates the expression of Mφ1 and Mφ2 markers in vitro. (A) Differentiation scheme of monocytes using GM-CSF, LPS, and IFNɣ to obtain Mφ1, and M-CSF, LPS, and IL4 to obtain Mφ2. LIPINOVA® was added on days 0, 3, and 5. (B) Representative dot plots of HLA-DR+, CD80+, and CD163+ cells assessed by flow cytometry on day 6 after differentiation.(C) Graphs representing flow cytometry quantification of Mφ1 (white), Mφ2 (grey), and Mφ1 incubated with LIPINOVA® at 250 nM (cyan) or 50 µM (green). Data are represented as mean ± SD of five independent experiments. (D) Gene expression levels of IL1β, CXCL10, CXCL11, and CD206 quantified by qPCR in Mφ1 (white), Mφ2 (grey), and Mφ1 incubated with 250 nM (cyan) or 50 µM (green) LIPINOVA® during differentiation. (E) ELISA assay to assess CXCL10 and IL1 β production by Mφ1 (white), Mφ2 (grey), and Mφ1 incubated with 250 nM (cyan) or 50 µM (green) LIPINOVA® at day 6 of differentiation. Data are represented as mean ± SD of four independent experiments. Each dot represent an independent experiment. One-way ANOVA was used for statistical analysis; * p < 0.05, ** p < 0.01, *** p < 0.001, and **** p < 0.0001.

