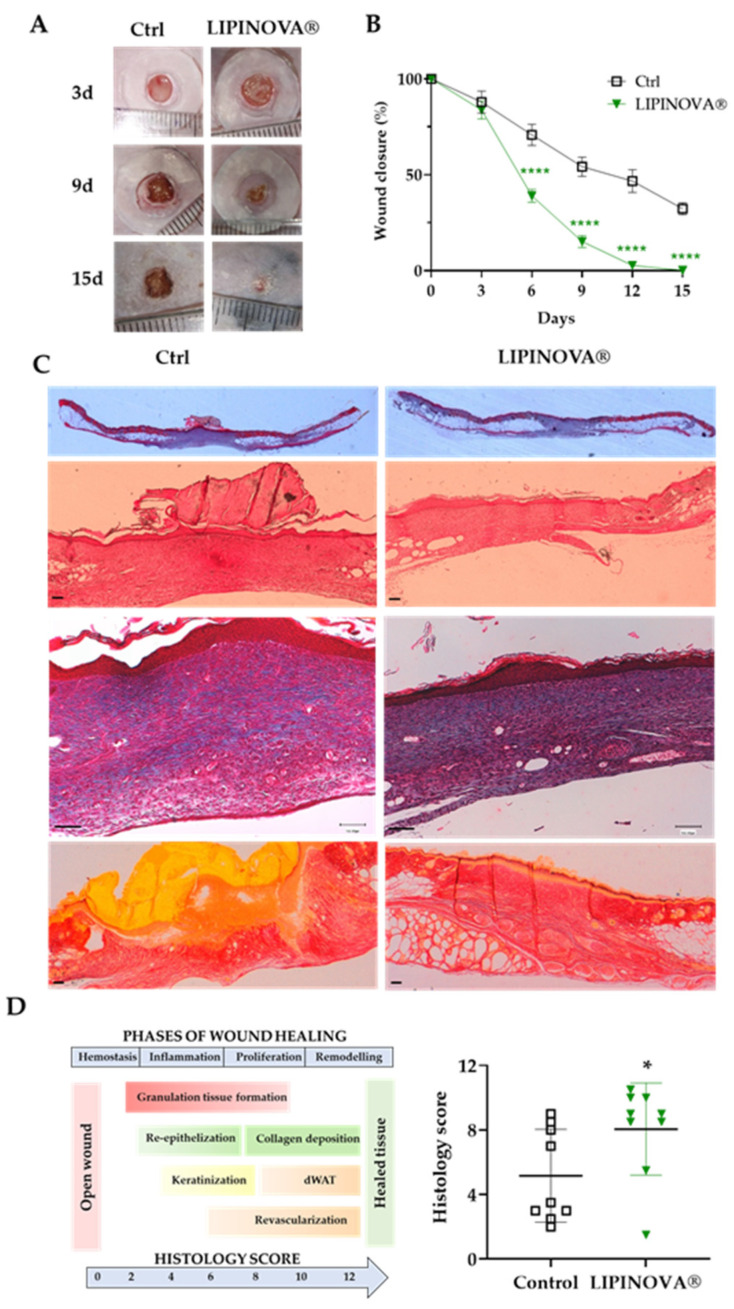
Figure 4.
The effect of topical LIPINOVA® on cutaneous wounds in db/db mice. (A) Representative images showing wounds of mice treated with saline (Ctrl) or with 50 ng LIPINOVA® at different time points (day 3, 9, and 15). (B) Kinetics of wound closure assessed at different time points as a percentage of the initial area in saline- and LIPINOVA®-treated animals (n = 9 animals per group, 2 wounds per animal). Data are represented as mean ± SEM. Two-way ANOVA was used for statistical analysis. (C) Representative images of wound sections stained with H&E, Masson’s trichrome, and Picrosirius red at day 15. Images were acquired at different magnifications; scale bar = 100 µm. (D) Histology score represented as mean ± SD of mice treated with 50 ng LIPINOVA® or saline obtained from H&E- and Masson’s trichrome-stained skin sections 15 days post-wounding. Dermal white adipose tissue (dWAT). The Mann–Whitney U test was used for statistical analysis; * p < 0.05, **** p < 0.0001.

