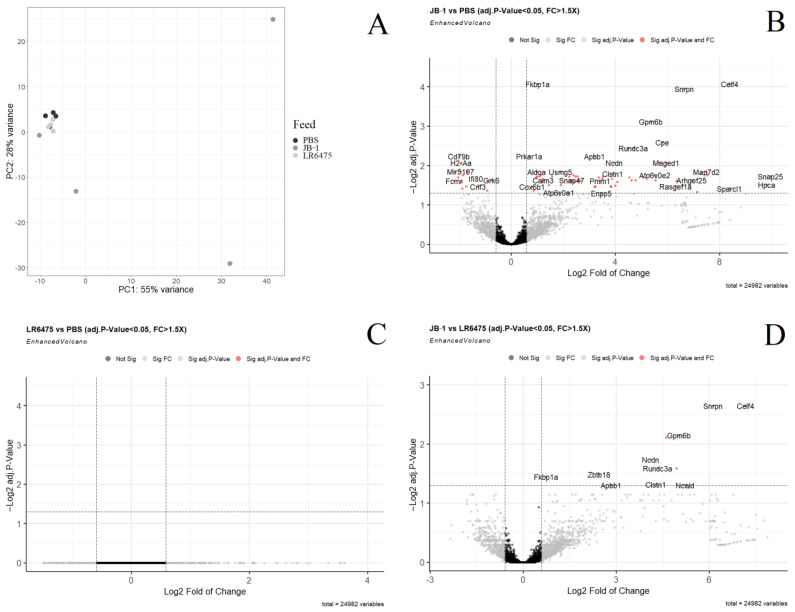
Figure 1.
Differential expression analysis of mRNA measured by RNAseq in the blood of mice fed either Lacticaseibacillus rhamnosus JB-1, Limosilactobacillus reuteri 6475, or PBS. (A) Principal component analysis of all three treatment groups. (B) Volcano plot showing individual differentially expressed genes in a comparison of JB-1 vs. PBS-fed mice. (C) Volcano plot showing individual differentially expressed genes in a comparison of LR6475 vs. PBS-fed mice. (D) Volcano plot showing individual differentially expressed genes in a comparison of JB-1 vs. LR6475-fed mice. Genes with a positive log fold change are more highly expressed.

