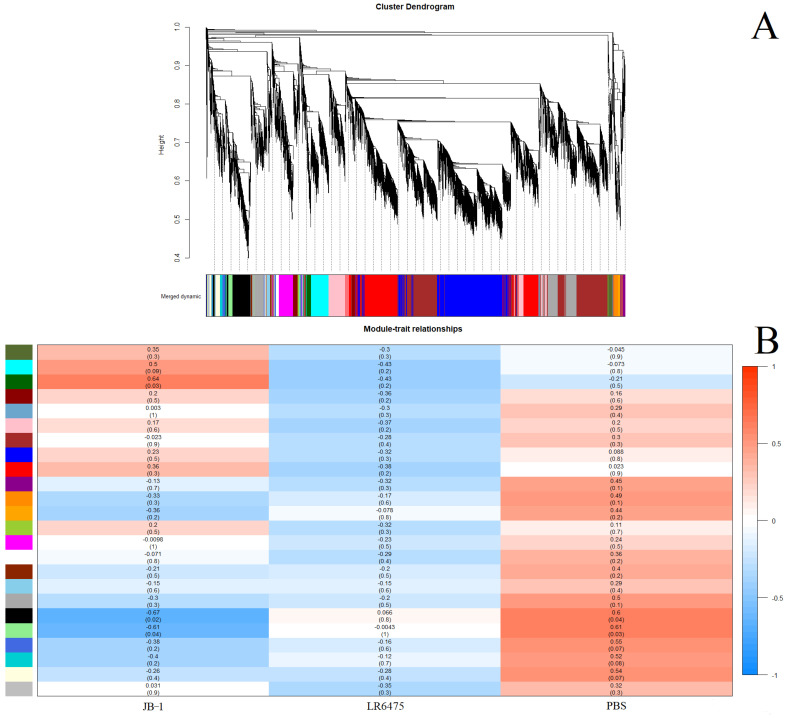
Figure 3.
Weighted correlation network analysis (WGCNA) of blood mRNA from mice fed one of JB-1, LR6475, or PBS. (A) Unsupervised cluster dendogram of commonly co-expressed genes shown grouped into modules by colour. (B) Gene module and feed group relationships shown in a heatmap with relative expression level and p-value in brackets under it for each relationship.

