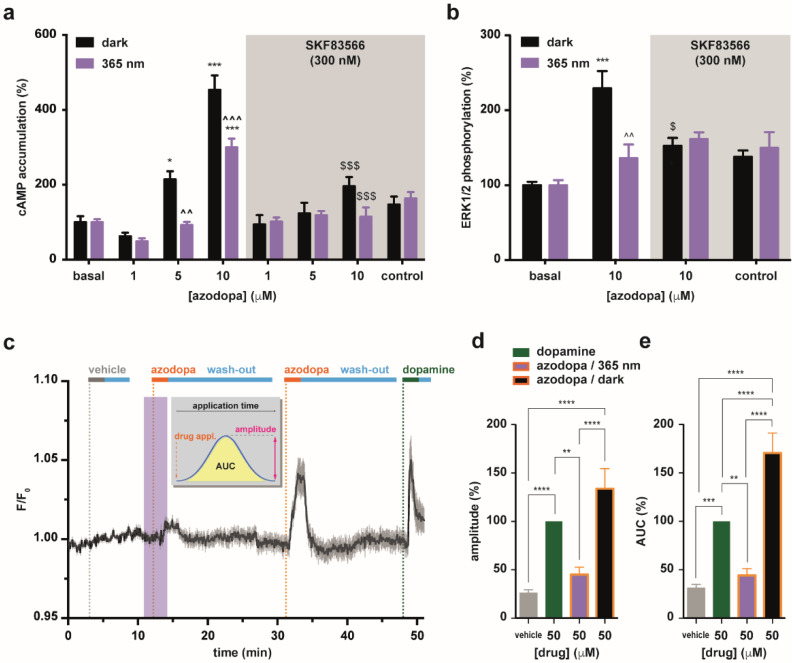
Figure 2.
In vitro pharmacological characterization of azodopa. (a) Effect on D1-mediated adenylyl cyclase activation. cAMP accumulation experiments in HEK-293T cells transiently transfected with D1 and treated with different concentrations of azodopa, in the dark (black bars) or under illumination (purple bars), in the presence (gray area) or not (white area) of a D1-like receptor antagonist (SKF83566). Values are represented in percentage vs. basal levels of cAMP. Data are mean ± S.E.M. (6 experiments performed in quadruplicate). Statistical differences were analyzed by two-way ANOVA followed by Tukey’s post hoc test (*** p < 0.001 vs. basal; * p < 0.05 vs. basal; ^^^ p < 0.001 vs. dark; ^^ p < 0.01 vs. dark; $$$ p < 0.001 vs. controls non-pretreated with the antagonist). (b) Effect on D1-mediated ERK1/2 activation. ERK1/2 phosphorylation was determined in HEK-293T cells transiently transfected with D1 and treated with different concentrations of azodopa, in the dark (black bars) or under illumination (purple bars), in the presence (gray area) or not (white area) of a D1-like antagonist (SKF83566). Values are represented in percentage vs. basal levels of ERK1/2 phosphorylation. Data are mean ± S.E.M. (3 or 4 experiments performed in triplicate or quadruplicate). Statistical differences were analyzed by two-way ANOVA followed by Tukey’s post hoc test (*** p < 0.001 vs. basal; ^^ p < 0.01 vs. dark; $ p < 0.05 vs. controls non-pretreated with the antagonist). (c–e) Effect on D1-mediated intracellular calcium release compared to dopamine. (c) Real-time calcium imaging response (averaged traces, black line, n = 24 cells) in HEK-293T cells co-expressing D1 receptors and R-GECO1 as calcium indicator. Traces were recorded upon direct application of azodopa (50 µM, orange bars) in the dark (white area) and under illumination (purple area). Shadow represents “± S.E.M.”. Gray and green bars indicate the application of vehicle (control) and dopamine (reference agonist), respectively. Light blue bars indicate wash-out periods. See example frames and raw data traces of individual cells in supplementary Figure S10, and supplementary Video S1 for the entire movie. Two values of the calcium responses generated by azodopa were calculated (Origin 8 software) and compared: the peak amplitude ΔF/F0 (d), calculated as the difference between the maximal and the minimal intensity of each response (**** p < 0.0001 for vehicle vs. dopamine; **** p < 0.0001 for vehicle vs. azodopa/dark; **** p < 0.0001 for azodopa/365 nm vs. azodopa/dark; ** p = 0.035 for dopamine vs. azodopa/365 nm), and the area under the curve (AUC) (e), calculated as the integral over the entire application time of vehicle or drugs (**** p < 0.0001 vehicle vs. dopamine; **** p < 0.0001 for vehicle vs. azodopa/dark; **** p < 0.0001 for dopamine vs. azodopa dark; **** p < 0.0001 for azodopa/365 nm vs. azodopa/dark; *** p = 0.001 for vehicle vs. dopamine; ** p = 0.0025 for dopamine vs. azodopa/365 nm). Data are mean ± S.E.M. (n = 40 cells from 3 independent experiments). Data were normalized over the maximum response obtained with the saturating concentration of dopamine (50 μM) and were analyzed by one-way ANOVA followed by Tukey’s post hoc test for statistical significance. All statistical analyses (panels (a,b,d,e)) were performed with GraphPad Prism 6.

